


In the evolving landscape of software architecture, modularity, reusability, and loose coupling are no longer optional—they are essential. Enter the UML Component Diagram, a powerful structural diagram in the Unified Modeling Language (UML) that captures the static implementation view of a system. It models how modular, replaceable components interact through well-defined interfaces, forming the backbone of modern systems such as microservices architectures, service-oriented applications, and large-scale enterprise platforms.
This article explores the core principles of UML component diagrams, illustrates their application through a real-world e-commerce system, and contrasts traditional modeling approaches with the transformative capabilities of Visual Paradigm’s AI Component Diagram Generator—a next-generation tool that redefines how architects and developers create, refine, and maintain professional-grade component models.
🔷 What Is a UML Component Diagram?
A UML Component Diagram is a structural diagram that visualizes the high-level modular structure of a software system. It emphasizes:
-
Modular, replaceable parts (components),
-
Their interfaces (contracts),
-
Dependencies, connectors, and ports,
-
And how they are interconnected to form cohesive applications.
Unlike class diagrams, which focus on classes, attributes, and methods, component diagrams operate at a higher abstraction level, representing deployable artifacts like libraries, services, or subsystems.
✅ Key Use Cases
-
Component-Based Development (CBD)
-
Microservices & Service-Oriented Architecture (SOA)
-
Polyglot programming environments
-
Event-driven systems
-
Large-scale enterprise applications requiring clear boundaries
🔧 Core Elements of UML Component Diagrams (UML 2.x)
Understanding these foundational elements is critical for accurate and meaningful modeling:
| Element | Description | Notation |
|---|---|---|
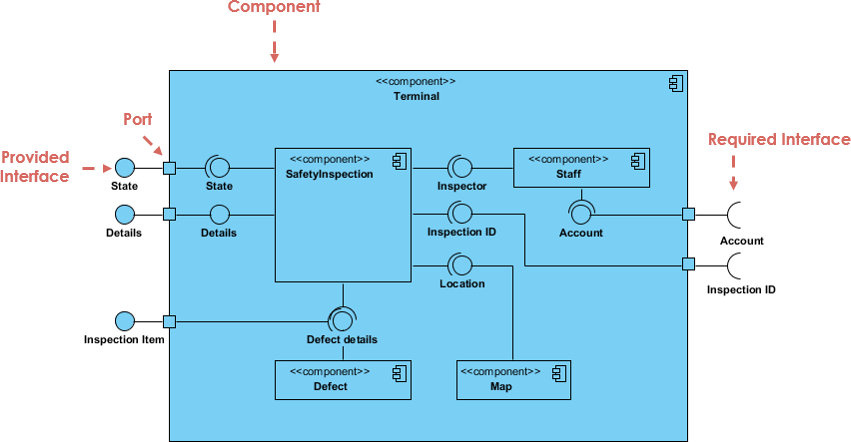
| Component | A modular, self-contained unit (e.g., a service or library). | Rectangle with «component» stereotype, optionally with a small icon in the top-right corner. |
| Provided Interface | What the component offers to others. | Lollipop symbol (circle with a line) — indicates “provides”. |
| Required Interface | What the component depends on. | Socket symbol (square with a circle) — indicates “requires”. |
| Port | An interaction point on a component’s boundary. | Small filled square on the component’s edge. |
| Assembly Connector | A line connecting a provided interface to a required interface. | Solid line showing direct dependency or interaction. |
| Dependency | A dashed arrow indicating one component depends on another. | Dashed line with open arrowhead. |
| Realization | Shows that a component implements an interface. | Dashed line with hollow arrowhead. |
| Subsystem / Package | Grouping mechanism for organizing components. | Nested rectangles or package notation. |
| Artifact | Physical manifestation of a component (e.g., .jar, .dll). |
File icon or labeled rectangle. |
| Node | Deployment environment (e.g., server, container). | 3D cube or labeled box. |
💡 Note: While nodes and artifacts are often used in deployment diagrams, they can be included in component diagrams to reflect physical deployment context.
🛒 Real-World Example: E-Commerce System with Microservices & Event-Driven Architecture
Consider a modern, polyglot e-commerce platform built with microservices, event-driven communication, and multiple frontends. The following PlantUML code captures a simplified version of this system:
@startuml
' Define components
component "Sales Management\n«Spring Boot»" {
    [Order Service]
    [Payment Handler]
}
component "Inventory Management\n«Node.js»" {
    [Stock Tracker]
    [Reorder Trigger]
}
component "Customer Support\n«Python + FastAPI»" {
    [Case Manager]
    [Chatbot Integration]
}
component "Payment Gateway\n«Stripe / PayPal»" {
    [API Client]
}
component "Shipping Provider\n«FedEx / DHL»" {
    [Shipment API]
}
component "Mobile App\n«React Native»" {
    [UI Layer]
}
component "Web Portal\n«Vue.js»" {
    [Frontend Router]
}
component "Admin Dashboard\n«Angular»" {
    [Analytics Panel]
}
component "Event Bus\n«Kafka»" {
    [Topic: PaymentConfirmed]
    [Topic: ShipmentCreated]
    [Topic: OrderUpdated]
    [Topic: StockUpdated]
    [Topic: CaseCreated]
}
component "Database\n«PostgreSQL»" {
    [ACID Transactions]
    [CRUD Operations]
}

' Draw dependencies
MobileApp --> SalesManagement : HTTPS POST /orders
WebPortal --> SalesManagement : HTTPS GET /orders
AdminDashboard --> CustomerSupport : HTTPS GET /cases

SalesManagement --> PaymentGateway : REST POST /charge
InventoryManagement --> ShippingProvider : REST POST /schedule

SalesManagement --> EventBus : Publish: OrderUpdated
InventoryManagement --> EventBus : Publish: StockUpdated
PaymentGateway --> EventBus : Publish: PaymentConfirmed
ShippingProvider --> EventBus : Publish: ShipmentCreated
CustomerSupport --> EventBus : Subscribe: CaseCreated

SalesManagement .> Database : CRUD
InventoryManagement .> Database : CRUD
CustomerSupport .> Database : CRUD

' Add interface notation (implied)
' (In full UML: use «provided» and «required» interfaces with lollipop/socket)
@enduml
📌 Key Observations from the Diagram
-
Modularity & Technology Diversity: Each core system uses a different tech stack (Spring Boot, Node.js, Python/FastAPI), reflecting polyglot programming.
-
RESTful APIs: Frontends communicate with backend services via HTTPS, showing synchronous integration.
-
Event-Driven Communication: Kafka acts as the central event bus, enabling asynchronous, decoupled communication.
-
Shared Database: All services interact with a single PostgreSQL instance, suggesting a shared data model (common in monolithic or bounded context designs).
-
Clear Interfaces & Contracts: Though not explicitly labeled as
«provided»/«required»in this sketch, the intent is clear—each service exposes and consumes well-defined APIs.
✅ This is a valid, practical component diagram that reflects modern architectural patterns.
🔄 From Text to Diagram: Comparing Modeling Approaches
Let’s examine how different methods generate component diagrams—and why Visual Paradigm’s AI-powered generator stands out.
| Aspect | Traditional (Manual) | General LLM (e.g., ChatGPT → Mermaid/PlantUML) | Visual Paradigm AI Generator |
|---|---|---|---|
| Input | Drag-and-drop, manual editing | Natural language or code prompt | Natural language or conversational input |
| Output Format | Native editable diagram (.vpp/.vpd) | Text code (PlantUML/Mermaid) or static image | Native editable diagram in Visual Paradigm |
| Layout Quality | High (user-controlled) | Often poor, overlapping, inconsistent | AI-optimized, clean, balanced layout |
| UML Compliance | High (if user is trained) | Variable (risk of hallucinations) | High (enforces UML standards) |
| Editability & Iteration | Excellent | Poor (must regenerate entire diagram) | Excellent (conversational refinement) |
| Speed (First Draft) | Slow | Fast | Very fast |
| Best For | Final deliverables, team collaboration | Quick sketches, brainstorming | Rapid prototyping → professional modeling |
🚀 Why Visual Paradigm’s AI Component Diagram Generator Is a Game-Changer
As of 2025–2026, Visual Paradigm’s AI-powered diagram generator has evolved beyond simple text-to-diagram conversion. It now integrates AI chatbot capabilities, context-aware modeling, and seamless integration with the full UML suite.
✨ Key Features
-
Natural Language Input
“Create a component diagram for an e-commerce system with Spring Boot sales, Node.js inventory, Kafka event bus, React Native mobile, Vue.js web portal, Stripe payment gateway, and PostgreSQL database.”
→ The AI interprets the request and generates a fully formed, professionally laid out component diagram.
-
Automatic UML Compliance
-
Correctly places components, interfaces (lollipop/socket), ports, and connectors.
-
Applies stereotypes (
«component»,«interface») accurately. -
Ensures dependency and realization relationships follow UML rules.
-
-
Intelligent Layout Engine
-
Avoids clutter and overlapping.
-
Groups related components logically (e.g., frontends together, backend services grouped).
-
Uses smart alignment, spacing, and flow direction (horizontal/vertical) for readability.
-
-
Conversational Refinement
You can iterate:-
“Add a new analytics service that subscribes to Kafka events.”
-
“Make the dependency between Inventory and Payment Gateway dashed.”
-
“Show a required interface for the Admin Dashboard to access the Customer Support service.”
The AI updates the diagram in real time—no re-prompting needed.
-
-
Integration with Other Diagrams
-
The generated component diagram can be linked to:
-
Sequence Diagrams (showing interactions),
-
Class Diagrams (defining internal structure),
-
Deployment Diagrams (showing physical deployment).
-
-
Enables traceability, model consistency, and documentation.
-
-
Export & Collaboration
-
Export to PDF, PNG, SVG, or embed in documentation.
-
Version control via Git integration.
-
Shareable links for team collaboration.
-
🏁 Conclusion: The Future of Software Architecture Modeling
While traditional tools offer precision and control, and general LLMs provide quick visualizations, Visual Paradigm’s AI Component Diagram Generator bridges the gap between speed, accuracy, and professionalism.
It transforms the “blank canvas” problem into a collaborative design journey, where architects can start with a simple description and evolve a production-ready model—complete with correct UML semantics, clean layout, and full editability.
✅ Final Takeaways
-
UML Component Diagrams are vital for modeling modular, scalable systems.
-
Modern systems (e.g., microservices, event-driven) benefit from clear component boundaries and interface contracts.
-
PlantUML/Mermaid are excellent for quick sketches but lack robust editing and layout control.
-
Visual Paradigm’s AI Generator delivers:
-
Faster prototyping,
-
Higher fidelity modeling,
-
Seamless iteration,
-
Professional-grade output.
-
🛠 Recommendation: For real-world software architecture work—especially in agile teams, startups, or enterprise environments—leverage Visual Paradigm’s AI-powered component diagram generator to accelerate design, improve clarity, and ensure compliance with industry standards.
📌 Bonus: Try It Yourself
Start with this prompt in Visual Paradigm AI Chat:
“Design a UML component diagram for a cloud-native e-commerce platform with the following components: Sales Service (Spring Boot), Inventory Service (Node.js), Payment Gateway (Stripe), Shipping Provider (FedEx), Kafka event bus, React Native mobile app, Vue.js web portal, Angular admin dashboard, and PostgreSQL database. Use REST APIs for frontend communication, Kafka for event-driven updates, and show dependencies and interfaces.”
👉 Watch as the AI generates a fully editable, professionally formatted diagram in seconds—ready for refinement, documentation, or integration into your architecture.
Build smarter. Model faster. Deliver with confidence. UML Component Diagram and AI Support
-
Component Diagram Software – Visual Paradigm Online: This powerful online tool allows developers to design detailed component diagrams that support UML standards and real-time team collaboration.
-
UML Component Diagram Tutorial and Tool – Visual Paradigm: A comprehensive guide and interactive tool designed to help users model software architecture and define complex component relationships.
-
Major Upgrade to AI UML Component Diagram Generation: This release details significant enhancements to the AI Chatbot, solidifying it as an essential tool for generating architectural diagrams through intelligent automation.
-
AI-Powered Component Diagrams with Visual Paradigm Chatbot: This article explores how the chatbot facilitates the creation of component diagrams using natural language input, streamlining the design process.
-
UML Component Diagram Tutorial: Designing Software Architecture: A technical video resource providing a step-by-step guide on creating diagrams to model the modular structure and dependencies of software systems.
-
AI-Generated UML Component Diagrams: A Comprehensive Guide: This guide focuses on using AI assistance to produce accurate and standards-compliant UML component models for system architecture.
-
Generating and Modifying C4 Component Diagrams with AI Chatbot: A specialized tutorial demonstrating how to use the AI-powered chatbot to create and iteratively refine C4 component-level diagrams.
-
UML Component Diagram Tutorial: Building Modular Software Systems: An in-depth walkthrough for developers and architects on modeling system components to ensure a robust software structure.
-
Why Teams Need AI Diagram Makers for Faster Project Kickoff: This article explains how automated diagram generation accelerates project starts by rapidly producing UML and component diagrams from text prompts.
-
Understanding Structural UML Diagrams for System Architecture: An overview of structural diagrams that depict the static aspects of a system, specifically highlighting classes, objects, and components.