Introduction: Why I Decided to Dive Deep into Class Diagrams
As someone who’s spent years navigating the complexities of software development, I’ll be honest—I used to think UML class diagrams were just “nice-to-have” documentation that busy teams skipped. That changed when I joined a mid-sized tech startup where unclear system architecture was causing real pain: duplicated code, misunderstood requirements, and onboarding new developers took weeks instead of days.

A senior architect suggested we start using class diagrams consistently, and I volunteered to lead the learning curve. What followed was a surprisingly rewarding journey. This article shares my firsthand experience learning, applying, and ultimately appreciating UML class diagrams—not as academic theory, but as a practical tool that transformed how our team designs and communicates about software. If you’re a developer, analyst, or student wondering whether class diagrams are worth your time, this review is for you.
What Exactly Is a Class Diagram? My “Aha!” Moment
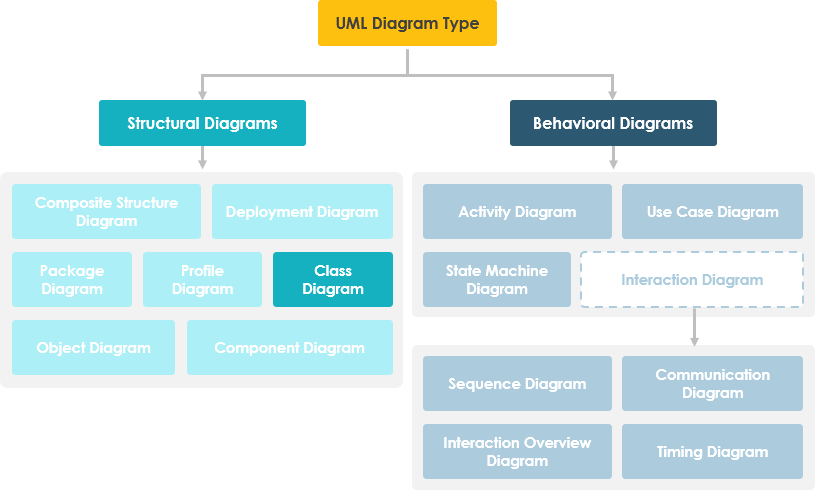
When I first encountered class diagrams, the formal definition felt abstract: “a type of static structure diagram in UML that describes the structure of a system by showing classes, attributes, operations, and relationships.”
But here’s what clicked for me: A class diagram is like an architectural blueprint for your code. Just as a building blueprint shows rooms, doors, and how they connect before construction begins, a class diagram shows your system’s core components and how they interact before a single line of code is written.
Why This Matters in Real Projects
From my experience, class diagrams deliver tangible value in four key ways:
-
They create a shared language between developers, business analysts, and stakeholders—no more “I thought you meant…” moments.
-
They catch design flaws early. I once spotted a circular dependency in a diagram that would have caused major refactoring pain later.
-
They accelerate onboarding. New team members grasp system structure in hours, not weeks.
-
They bridge business and tech. Our business analysts started sketching domain concepts as classes, making requirements conversations far more precise.
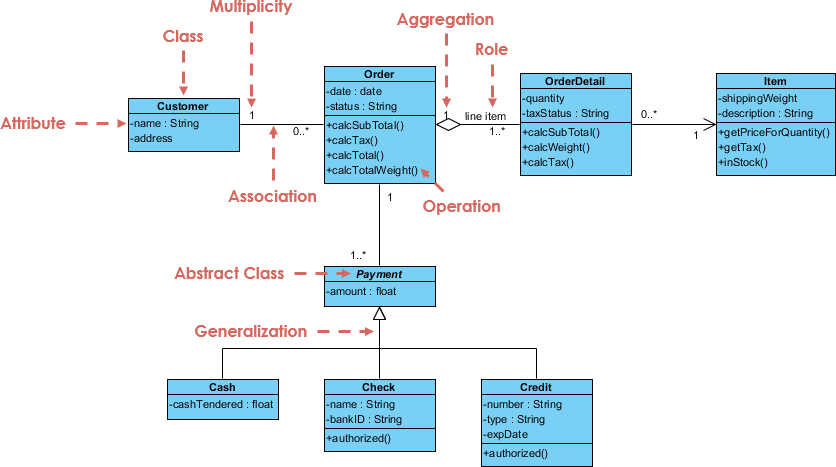
Breaking Down the Building Blocks: What I Learned About Classes
Understanding the Anatomy of a Class
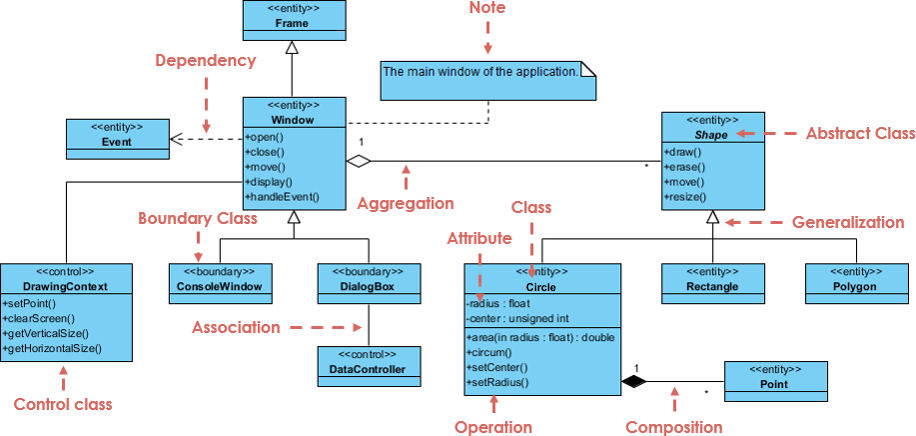
Early on, I struggled with UML notation until I realized every class box has three simple parts:

-
Top section: Class Name
My takeaway: Keep names meaningful and singular (e.g.,Customer, notCustomers). Abstract classes appear in italics—a small detail that prevents confusion. -
Middle section: Attributes
These define what objects “know.” I learned to include types after a colon (name: String) and use visibility markers:-
+public (accessible everywhere) -
-private (class-only access) -
#protected (accessible to subclasses) -
~package (accessible within same package)
-
-
Bottom section: Operations (Methods)
These define what objects “can do.” I now always specify parameter types and return values (calculateTotal(amount: float): double). It feels verbose at first, but it eliminates ambiguity during implementation.
Visibility in Practice: A Lesson Learned the Hard Way
Early in my diagramming journey, I made everything public for “simplicity.” Big mistake. When we implemented the code, encapsulation broke down, and debugging became a nightmare. Now I follow this rule of thumb: Start private, expose only what’s necessary. The visibility table below became my cheat sheet:
| Access Right | public (+) | private (-) | protected (#) | Package (~) |
|---|---|---|---|---|
| Members of the same class | yes | yes | yes | yes |
| Members of derived classes | yes | no | yes | yes |
| Members of any other class | yes | no | no | in same package |
Mapping Relationships: The Heart of System Design
This is where class diagrams truly shine. Understanding how classes connect transformed how I think about system architecture. Here are the relationship types I use daily, with real-world examples from my projects:
1. Inheritance (Generalization): The “Is-A” Relationship
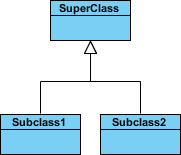
My experience: When modeling a payment system, I used inheritance to show that CreditCardPayment and PayPalPayment are specialized types of Payment. The hollow arrowhead pointing to the parent class became my visual cue for “this extends that.” Pro tip: Always name abstract parents generically (Payment, not CreditCardProcessor).
2. Simple Association: Peer Connections
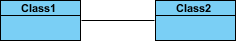
My experience: In an e-commerce module, I linked Order and Customer with a simple association. Adding relationship names (“places,” “contains”) made diagrams self-documenting. I now read them aloud: “A Customer places an Order”—if it sounds natural, the name works.
3. Aggregation vs. Composition: The “Part-Of” Nuance
This distinction tripped me up initially. Here’s how I finally internalized it:
Aggregation (unfilled diamond): Parts can exist independently.
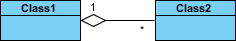
Real example: A Department aggregates Employee objects. If the department dissolves, employees still exist.
Composition (filled diamond): Parts live and die with the whole.
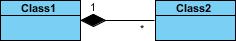
Real example: An Order composes OrderLineItem objects. Delete the order, and its line items vanish too.
4. Dependency: The “Uses-At-Runtime” Link
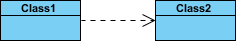
My experience: I use dashed arrows for temporary relationships. When ReportGenerator uses DataFormatter only during PDF export, that’s a dependency—not a permanent association. This helped me identify unnecessary couplings during code reviews.
Multiplicity: Quantifying Relationships
Early diagrams lacked cardinality, leading to implementation surprises. Now I always specify:
-
1= exactly one -
0..1= zero or one -
*= many -
1..*= one or more

Practical example: In a course enrollment system, I modeled Student "0..*" — "1..*" Course. This clarified that students can take multiple courses, and courses require multiple students—preventing a critical business logic bug.
Choosing the Right Perspective: Lessons from Different Project Phases
One insight that elevated my diagramming: not all class diagrams need the same level of detail. I now adapt my approach based on project phase:
Conceptual Perspective (Early Discovery)
-
Focus: Real-world domain concepts
-
Detail: Minimal—just class names and key relationships
-
My use case: Workshop whiteboarding with product owners. We sketched
Customer,Order,Productwithout attributes to align on scope.
Specification Perspective (Design Phase)
-
Focus: Software interfaces and contracts
-
Detail: Attributes, operations, visibility—but no implementation specifics
-
My use case: API design sessions. We defined
PaymentProcessor.process(amount: double): booleanbefore choosing a payment gateway.
Implementation Perspective (Coding Phase)
-
Focus: Technology-specific details
-
Detail: Full signatures, framework annotations, database mappings
-
My use case: Onboarding developers. Diagrams included JPA annotations (
@Entity,@OneToMany) to accelerate coding.
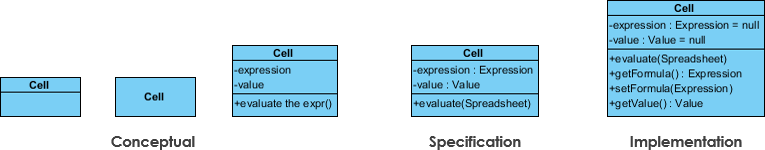
Key lesson: Start conceptual, evolve toward implementation. Trying to capture everything upfront leads to diagram paralysis.
Tools I Tested: My Hands-On Review of Visual Paradigm
After researching free UML tools, I tried Visual Paradigm Community Edition. Here’s my unbiased review after three months of daily use:
What I Loved ✅
-
Truly free for learning: No watermarks, no time limits, no diagram caps—critical for students and small teams.
-
Intuitive drag-and-drop: Creating classes felt natural; connectors snapped cleanly without manual alignment.
-
Smart notation enforcement: The tool auto-formatted visibility symbols (
+,-) and relationship arrows, reducing notation errors. -
Export flexibility: I exported diagrams as PNGs for presentations and PDFs for documentation—both looked professional.
Areas for Growth ⚠️
-
Learning curve for advanced features: AI-assisted generation is powerful but requires clear prompts. I spent an afternoon mastering prompt engineering.
-
Desktop vs. Online trade-offs: The desktop app has deeper modeling features; the online version is faster for quick sketches. I use both contextually.
My Workflow Now
-
Sketch initial concepts in VP Online during meetings (no install needed)
-
Refine in Desktop Edition with team feedback
-
Embed final diagrams in Confluence using OpenDocs integration
-
Use AI Class Diagram Wizard for boilerplate generation when starting new modules
Real impact: Our sprint planning time dropped by 30% because diagrams made requirements unambiguous. Developers spent less time clarifying and more time building.
Practical Tips from My Trial-and-Error Journey
After creating dozens of diagrams, these practices saved me hours:
-
Start small, iterate often
Don’t model the entire system upfront. Begin with one module (e.g., “User Authentication”), validate with the team, then expand. -
Use notes strategically
Grey annotation boxes clarified business rules without cluttering class boxes. Example: “Note: Discount applies only to first-order customers.” -
Hide details when presenting to non-tech stakeholders
For executive reviews, I show only class names and high-level relationships. Save attributes/operations for developer sessions. -
Validate with code
After diagramming, I write skeleton classes. If the code feels awkward, the diagram likely needs refinement. -
Embrace multiple diagrams for complex systems
Instead of one overwhelming diagram, I created focused views: “Domain Model,” “API Contracts,” “Database Schema.” Navigation between them became part of our documentation.
Conclusion: Why Class Diagrams Earned a Permanent Spot in My Toolkit
When I started this journey, I viewed class diagrams as documentation overhead. Today, I see them as collaboration accelerators and design safety nets. They haven’t just improved our code quality—they’ve transformed how our team communicates, plans, and solves problems together.
The biggest surprise? Class diagrams aren’t about perfection. My early diagrams were messy, incomplete, and sometimes wrong. But they sparked conversations that prevented bigger mistakes. As one senior engineer told me: “A good diagram isn’t the one with perfect notation—it’s the one that gets the team aligned.”
If you’re hesitant to start, begin with one relationship in your current project. Sketch it. Share it. Refine it. You might discover, as I did, that this “academic” tool delivers very real, very practical value.
Ready to try? I started with Visual Paradigm’s free edition (no credit card needed), and within an hour, I had my first usable diagram. Sometimes the best way to learn is by doing—and with class diagrams, the doing is surprisingly rewarding.
References
-
Unified Modeling Language (UML): Comprehensive Wikipedia overview of UML standards, history, and diagram types.
-
Visual Paradigm Community Edition Download: Free UML modeling software supporting all diagram types with no usage limitations for personal/educational use.
-
Visual Paradigm AI Chatbot: AI-powered assistant for generating and refining UML class structures through natural language prompts.
-
Visual Paradigm OpenDocs: Platform for embedding AI-generated diagrams directly into living documentation pages.
-
AI Class Diagram Wizard: Step-by-step AI assistant for generating classes, attributes, and operations from requirements.
-
Use Case Studio: Tool that automatically extracts domain classes from behavioral use case descriptions.
-
Agilien: Platform bridging agile user stories and epics directly to structural UML models.
-
DB Modeler AI: AI tool for generating conceptual domain class diagrams optimized for database design.
-
MVC Architecture Generator: Specialized tool for generating Controller-focused class diagrams in MVC patterns.
-
AI Class Diagram Guide: Tutorial series on leveraging AI for efficient class diagram creation.
-
Visual Paradigm AI Ecosystem Overview: Comprehensive guide to Visual Paradigm’s integrated AI-powered diagramming tools.
-
Systems Development Life Cycle (SDLC): Wikipedia resource on software development phases where class diagrams add value.
-
Programming Language Concepts: Foundational reference for understanding implementation-perspective class diagrams.
-
Visual Paradigm Online Free Edition: Browser-based free UML editor with no ads, no time limits, and unlimited diagrams for personal use.
-
Visual Paradigm Pricing & Upgrades: Information on premium features and team collaboration capabilities beyond the free tier.
-
Star-Based LAN Class Diagram Example: Interactive, editable example of a network architecture class diagram.