Data integrity relies on visibility. Without a clear map of how information moves through a system, organizations operate blindly. Tracing data lineage provides that map, documenting the journey from origin to consumption. Data Flow Diagrams serve as the foundational visual language for this task. They translate complex technical processes into understandable structures, allowing teams to track transformations and dependencies with precision. This approach ensures that every piece of data can be accounted for, supporting compliance, debugging, and strategic decision-making.
The process involves more than just drawing lines between boxes. It requires a deep understanding of the underlying architecture, the logic driving transformations, and the storage mechanisms involved. By leveraging standardized diagramming techniques, technical teams can create a living documentation that evolves alongside the infrastructure. This document outlines the methodology for implementing lineage tracing through flow diagrams, focusing on clarity, accuracy, and long-term maintainability.
Understanding Data Lineage 🧬
Data lineage refers to the history of data. It captures the origins, movements, and transformations that data undergoes throughout its lifecycle. Imagine a drop of water entering a river system; lineage tracks where it came from, which tributaries it passed through, and where it eventually flows out. In a digital context, this means knowing which database table generated a record, which script processed it, and which dashboard displays the final metric.
Establishing lineage is critical for several reasons. First, it aids in troubleshooting. When a number in a report seems incorrect, lineage allows engineers to trace the value backward to identify where the discrepancy occurred. Second, it supports regulatory compliance. Laws regarding data privacy often require organizations to know exactly where personal information resides and how it is used. Finally, it builds trust. Stakeholders are more likely to rely on analytics when they understand the source and processing logic behind the numbers.
Lineage can be categorized into two primary types: logical and physical. Logical lineage describes the conceptual movement of data, such as “Customer ID moves from Sales to Billing.” Physical lineage details the specific technical steps, like “Column 5 from Table A is extracted via SQL Query B into Column 3 of Table C.” Flow diagrams effectively bridge these two, providing a visual representation that satisfies both business stakeholders and technical engineers.
The Role of Data Flow Diagrams 📊
Data Flow Diagrams (DFDs) are graphical representations of how data moves through a system. Unlike entity-relationship diagrams, which focus on static relationships between data objects, DFDs emphasize the dynamic flow and processing of information. They break down complex systems into manageable components, making them ideal for mapping lineage.
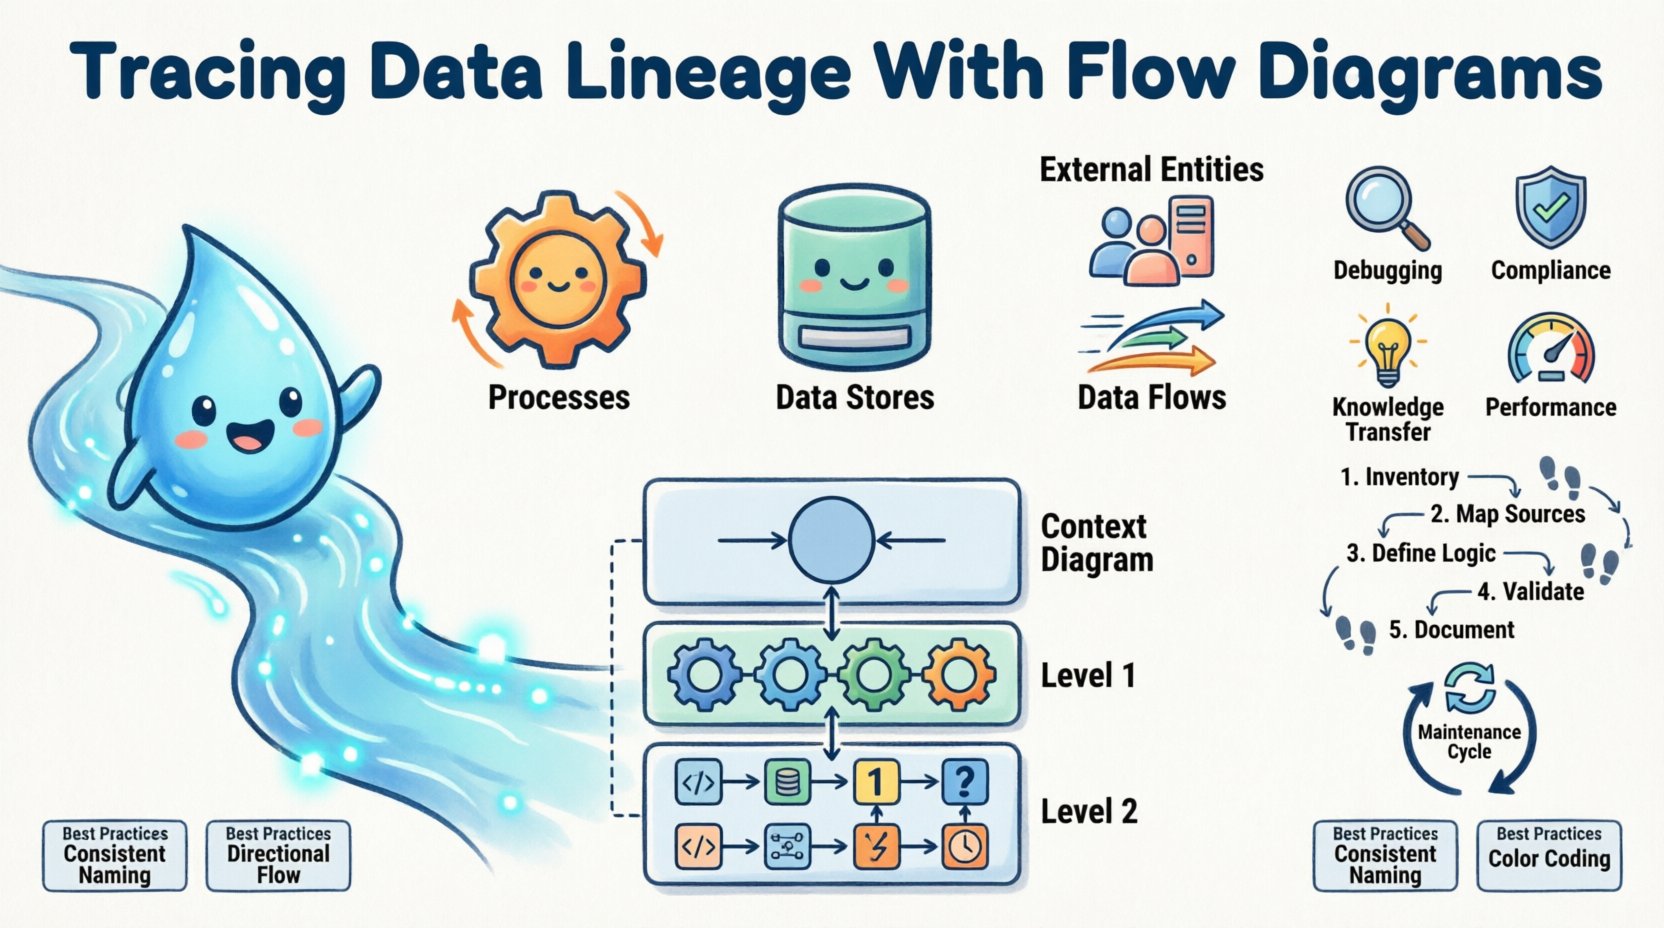
A standard DFD consists of four core elements:
Processes: Actions that transform data. These are usually represented by circles or rounded rectangles. Examples include “Calculate Tax” or “Aggregate Sales Data”.
Data Stores: Where data rests. These are open-ended rectangles representing databases, files, or queues.
External Entities: Sources or destinations outside the system boundaries. Users, other systems, or regulatory bodies often fall into this category.
Data Flows: The arrows connecting the elements, indicating the direction and content of the data movement.
When used for lineage tracing, these elements become nodes in a larger graph. The connections reveal the path. By adhering to DFD standards, teams ensure consistency. A process in one diagram follows the same visual rules as a process in another, reducing cognitive load for anyone reviewing the documentation.
Levels of Diagram Detail 🛠️
To manage complexity, DFDs are often created at different levels of abstraction. This hierarchy allows stakeholders to zoom in on specific areas without getting overwhelmed by the entire system architecture. The standard approach involves three levels of depth.
Level
Description
Use Case
Context Diagram (Level 0)
High-level overview showing the system as a single process and its interaction with external entities.
Executive summaries and high-level architecture planning.
Level 1 Diagram
Breaks the main process into major sub-processes and data stores.
System design and identifying major data touchpoints.
Level 2 Diagram
Further decomposes specific processes from Level 1 into detailed steps.
Technical implementation, code review, and detailed auditing.
This tiered approach prevents the diagram from becoming unreadable. A single page showing every single SQL join and API call would be chaotic. Instead, the Context Diagram provides the big picture, while the Level 2 diagrams offer the granularity needed for engineering tasks. When tracing lineage, it is often necessary to cross-reference these levels. A query in a Level 2 diagram might be summarized as a single process in a Level 1 diagram.
Steps to Implement Lineage Tracing 📝
Creating an accurate lineage map requires a systematic approach. Ad-hoc drawing leads to inconsistencies and missing links. The following steps outline a robust workflow for building and maintaining flow diagrams for data lineage.
1. Inventory Existing Assets
Before drawing, you must know what exists. Compile a list of all databases, data warehouses, application servers, and reporting tools involved. Identify the primary data sources, such as transactional systems or external APIs. This inventory forms the boundary of your diagram. Without a complete list, the lineage will have gaps, leading to blind spots in governance.
2. Map Data Sources to Destinations
Begin at the source. Identify the initial entry point of the data. Trace it forward to the first processing step. Document the transformation logic. Does a script clean the data? Does a view filter specific rows? Record this at the process level. Continue tracing until you reach the final destination, such as a business intelligence dashboard or an archival storage system.
3. Define Transformation Logic
Data rarely stays static. It is aggregated, joined, or calculated. These transformations are the critical points in the lineage. Document the specific rules applied. For example, “Null values in Column X are replaced with 0” or “Timestamps are converted from UTC to Local Time.” This level of detail is essential for debugging. If a downstream report shows unexpected values, knowing the transformation rule allows you to replicate the error in a test environment.
4. Validate with Technical Teams
A diagram drawn in isolation is prone to error. Review the draft with the engineers who built the pipelines and the analysts who use the data. They can identify missing steps or incorrect assumptions. This collaboration ensures the diagram reflects reality, not just the theoretical design. Validation is a crucial step in maintaining the integrity of the lineage documentation.
5. Document Metadata
Attach metadata to the diagram elements. This includes version numbers, owner names, and creation dates. Data flows change over time. A process might be refactored next quarter. Metadata allows you to track the history of the diagram itself, ensuring that you know which version of the lineage map was active during a specific audit period.
Benefits of Structured Lineage 🏗️
Investing time in detailed flow diagrams yields tangible returns across the organization. The benefits extend beyond simple documentation.
Reduced Debugging Time: When errors occur, engineers spend less time searching for the root cause. The diagram acts as a guide, pointing directly to the likely area of failure.
Improved Impact Analysis: If a change is proposed, such as modifying a column name, the lineage map shows exactly which reports and downstream processes will break. This prevents accidental outages.
Regulatory Compliance: Auditors require proof of data handling. Flow diagrams provide a clear, visual audit trail that satisfies requirements for data privacy and security.
Knowledge Transfer: New team members can understand the system architecture quickly. Instead of relying on tribal knowledge, they can study the diagrams to grasp how data flows through the organization.
Optimized Performance: Analyzing the flow often reveals bottlenecks. If data waits too long at a specific store or process, the diagram highlights where optimization efforts should be focused.
Maintaining the Diagrams 🔄
A lineage map is not a one-time task. Systems evolve. New data sources are added, and old processes are retired. If the diagrams are not updated, they become misleading. Maintaining accuracy requires a disciplined approach to change management.
Every time a data pipeline is modified, the diagram should be reviewed. This should be part of the deployment checklist. If a new API is integrated, the external entity and data flow must be added. If a transformation logic changes, the process box description must be updated. Treating the diagram as code ensures it remains a reliable resource.
Automation can assist with maintenance. Some platforms allow for the generation of diagrams based on metadata repositories. While manual review is still necessary, automation reduces the burden of keeping the visual representation in sync with the technical reality. However, relying solely on automation can miss the business context, so human oversight remains vital.
Addressing Complexity ⚖️
Large enterprises often deal with intricate data ecosystems. Thousands of tables and hundreds of processes can make a single diagram overwhelming. In these scenarios, modularity is key. Break the lineage into logical domains. Create separate diagrams for Sales Data, Customer Data, and Financial Data. Link them together where they intersect, but keep the main views focused.
Another challenge is handling legacy systems. Older systems might lack the metadata required for automatic tracing. In these cases, manual reconstruction is necessary. Interview the original developers or review old documentation to infer the flow. Be transparent about these gaps. Mark areas of uncertainty on the diagram to indicate where further investigation is needed.
Best Practices for Clarity 🚀
To ensure the diagrams serve their purpose, follow these guidelines for design and presentation.
Consistent Naming: Use standard names for processes and data stores across all diagrams. Avoid abbreviations that confuse readers.
Directional Flow: Arrange diagrams to flow logically from left to right or top to bottom. This aligns with natural reading patterns.
Color Coding: Use colors to indicate status. For example, green for active processes, red for deprecated ones, and yellow for those requiring review.
Layering: Keep the high-level view separate from the detailed view. Do not clutter the main diagram with every single field mapping.
Access Control: Ensure that diagrams are accessible to those who need them. Security teams may need to see data flows involving sensitive information, while developers need to see the technical implementation.
Final Considerations 🔍
Tracing data lineage with flow diagrams is a discipline that blends technical precision with clear communication. It transforms abstract data movements into concrete visual models. By following established standards and maintaining a rigorous update cycle, organizations can achieve a high degree of data transparency. This transparency is the bedrock of modern data governance.
The effort required to build and maintain these diagrams pays off in reduced risk and increased efficiency. As data volumes grow and regulations tighten, the ability to trace the origin and journey of data will become even more critical. Investing in clear, accurate flow diagrams today prepares the organization for the challenges of tomorrow. The goal is not just to document the system, but to understand it deeply enough to improve it continuously.