Understanding how information moves through a system is critical for any analyst or developer. A Data Flow Diagram (DFD) provides a visual representation of this movement. It maps out where data originates, how it changes, and where it ends up. This guide outlines the process of creating these diagrams with precision and clarity.
Why Visualize Data Movement? 📊
Before picking up a pen or opening a canvas, it is necessary to understand the purpose of the diagram. A DFD is not a flowchart. It does not show control flow or logic decisions. Instead, it focuses strictly on the movement of data. This distinction is vital for maintaining accuracy.
Visualizing data flow offers several tangible benefits:
- Clarity: Complex systems become easier to comprehend when broken into visual components.
- Communication: Stakeholders can discuss system behavior without needing code knowledge.
- Gap Analysis: Missing data stores or unnecessary flows become visible during the drafting process.
- Documentation: The diagram serves as a living record of system requirements.
Core Components of a Data Flow Diagram 🧩
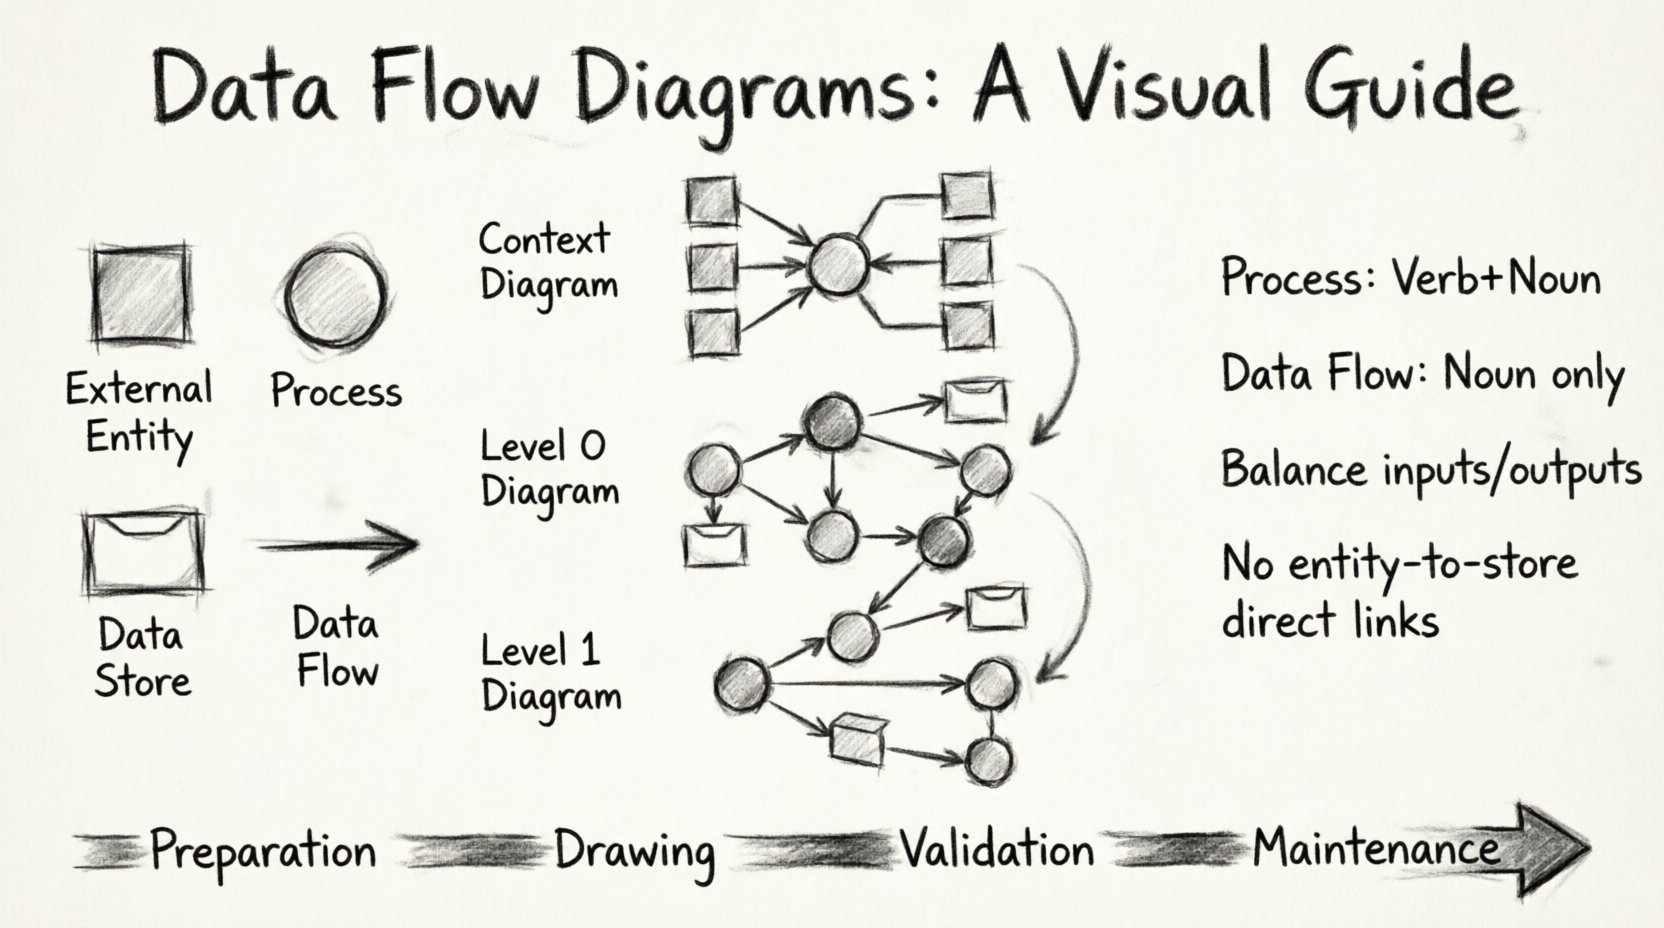
Every DFD relies on four standard symbols. These symbols form the vocabulary of the diagram. Using them correctly ensures that anyone reading the chart understands the architecture.
1. External Entity (The Source or Destination)
External entities represent people, organizations, or other systems that interact with the process. They sit outside the system boundary. Data flows in from them or out to them. They are typically drawn as squares or rectangles.
2. Process (The Transformation)
A process changes data. It takes input, performs a calculation or action, and produces output. This is the heart of the diagram. Processes are usually depicted as circles or rounded rectangles. Every process must have at least one input and one output.
3. Data Store (The Repository)
Data stores hold information for later use. Unlike processes, they do not transform data; they simply keep it safe. Examples include databases, files, or queues. These are often shown as open-ended rectangles or parallel lines.
4. Data Flow (The Connection)
Data flows represent the movement of information. Arrows indicate the direction. Every flow must be labeled with a noun phrase describing the data, not a verb. For example, “Order Details” is correct, whereas “Process Order” is incorrect.
Preparation Phase 📝
Jumping straight into drawing often leads to confusion. Preparation ensures the diagram remains manageable. Follow these steps before creating the first line.
Define the System Boundary
Identify what is inside the system and what is outside. Everything within the boundary is managed by the software or process. Everything outside is external. This boundary helps determine where to place external entities.
Gather Information Sources
Review existing documentation, interview stakeholders, and examine current workflows. You need to know what data enters the system and what results are expected. Without accurate input data, the diagram will be speculative.
Step 1: The Context Diagram 🌍
The Context Diagram is the high-level view. It shows the entire system as a single process and the external entities that interact with it. This is the starting point for any DFD.
- Identify the Single Process: Draw a circle or bubble representing the entire system. Give it a name, such as “Order Management System.”
- Place External Entities: Draw squares for all users, departments, or external systems involved. Examples include “Customer,” “Warehouse,” or “Payment Gateway.”
- Draw Data Flows: Connect entities to the central process using arrows. Label each arrow with the data being exchanged. Ensure arrows go both ways if data is sent and received.
- Verify Completeness: Check that every external interaction is accounted for. If an entity sends data but receives none, verify if a response is missing.
Step 2: The Level 0 Diagram (Top-Level) 🏗️
Once the context is established, decompose the single process into major sub-processes. This is known as the Level 0 diagram. It breaks the system into major functional areas.
- Decompose the Process: Replace the single context process with 3 to 7 major processes. Avoid too many, as it creates clutter, or too few, as it lacks detail.
- Identify Data Stores: Determine where data needs to be saved at this level. Place data stores between processes where information is retrieved or stored.
- Connect Flows: Draw arrows between processes, entities, and stores. Ensure every process has input and output.
- Maintain Balance: The inputs and outputs at this level must match the Context Diagram. If the Context Diagram shows “Order” entering, the Level 0 diagram must show “Order” entering one of the sub-processes.
Step 3: Decomposition to Level 1 and Beyond 🔍
If a process in the Level 0 diagram is complex, it requires further breakdown. This creates a Level 1 diagram. You can continue this process until the processes are simple enough to implement directly.
Rules for Decomposition
- One Process at a Time: Focus on breaking down one sub-process before moving to the next. Do not attempt to draw the entire system at once.
- Preserve Flows: When you break a process into smaller ones, the data flowing into the original process must flow into the new sub-processes. The data flowing out must come from the new sub-processes.
- Limit Detail: Stop decomposing when the logic is clear enough for a developer to code without further explanation. Usually, three levels are sufficient for most systems.
Naming Conventions and Best Practices 🏷️
Consistent naming makes the diagram readable. Inconsistent naming leads to confusion and errors.
Process Names
Process names should be verbs followed by a noun. Examples include “Validate User,” “Calculate Tax,” or “Generate Report.” This indicates action. Avoid vague names like “System” or “Data.” Use active verbs to describe the transformation.
Data Flow Names
Data flow names should be nouns or noun phrases. Examples include “Customer ID,” “Invoice,” or “Payment Receipt.” Avoid verbs like “Send Invoice” because the flow itself is the data, not the action. The action is the process.
Entity Names
External entities should be singular or plural nouns representing the actor. Use “Customer” not “Customer Data.” Use “Warehouse” not “Warehouse Management.” The entity is the actor, not the data.
Data Flow Rules and Constraints ⚖️
Adhering to strict rules prevents logical errors in the design. These constraints ensure the diagram represents a valid system.
| Rule |
Description |
| Data Store Input |
Data can only be written to a store from a process. Direct flows between entities and stores are generally not allowed. |
| Data Store Output |
Data can only be read from a store by a process. Entities cannot access stores directly. |
| Process Input/Output |
Every process must have at least one input and one output. A process that eats data without producing it is a “black hole.” A process that creates data without input is a “magic source.” Both are errors. |
| Data Flow Crossing |
Data flows should not cross data stores or external entities directly. They must go through a process. |
Validation and Review ✅
Once the diagram is drawn, it must be validated. This step ensures the model matches reality.
Check for Balancing
Compare the inputs and outputs of a parent process against its child processes. The data entering the parent must equal the data entering the children. The data leaving the parent must equal the data leaving the children. If they do not match, the diagram is unbalanced and requires correction.
Check for Completeness
Review every data flow. Does every piece of data have a destination? Does every process have a source? Are there orphaned data stores with no connections? A complete diagram has no loose ends.
Stakeholder Verification
Show the diagram to the people who use the system. Ask them to trace the data flow. Do they agree with the path? Do they identify missing steps? Their feedback is the ultimate test of accuracy.
Maintaining the Diagram 🔄
A DFD is not a one-time task. Systems evolve, and requirements change. The diagram must evolve with them.
- Version Control: Keep track of changes. Label versions with dates or numbers.
- Update Regularly: Whenever a new feature is added or a process changes, update the DFD immediately.
- Archive Old Versions: Keep older diagrams for reference during audits or debugging.
Conclusion on Visual Accuracy 🎯
Creating a Data Flow Diagram is a disciplined exercise in logic and visualization. It requires patience to decompose complex systems into understandable parts. By following the steps outlined above, you can produce a diagram that serves as a reliable blueprint for development and communication.
The goal is not just to draw lines, but to understand the flow. When the data flows are clear, the system design becomes clear. This clarity reduces errors and improves the final product. Focus on the data, not the code, and the diagram will serve its purpose effectively.