Understanding how a system behaves over time is critical for designing robust software and complex mechanical processes. A state diagram, often referred to as a state machine diagram, provides the visual vocabulary to map this behavior. It captures the dynamic nature of a system, showing how it moves from one condition to another based on specific triggers. This guide explores the foundational concepts required to model these behaviors effectively, ensuring clarity in design and implementation.
What Is a State Machine Diagram? 🤔
A state diagram is a type of behavioral diagram used in software engineering and systems modeling. It illustrates the discrete states that an object or system can occupy and the transitions between those states. Unlike static diagrams that show structure, this model focuses on flow and logic. It answers fundamental questions: What happens when an event occurs? How does the system react? What conditions must be met before moving forward?
These diagrams are derived from the mathematical theory of finite state machines. They are particularly useful for systems with distinct modes of operation. For example, a traffic light controller, a login sequence, or an elevator control system all follow predictable paths. By mapping these paths visually, developers can identify logic gaps, deadlocks, or unreachable conditions early in the design phase.
Core Components of a State Diagram 🧩
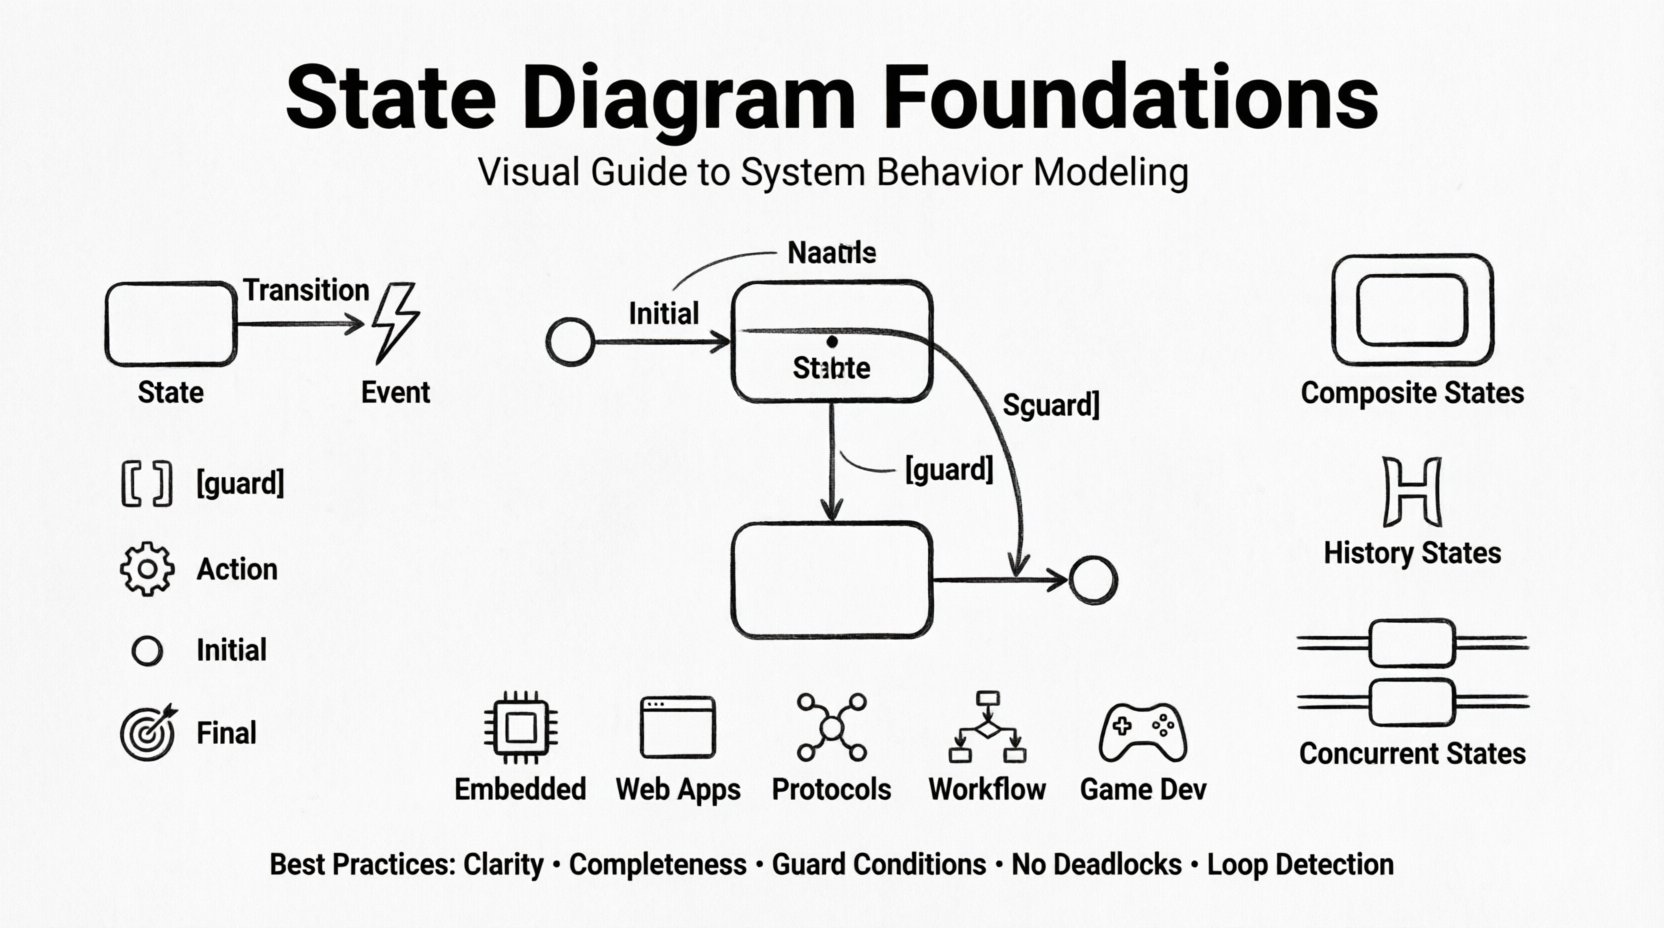
To construct a meaningful diagram, one must understand the building blocks. Each element serves a specific purpose in defining the lifecycle of the system. The following components form the skeleton of any state model.
- State: A condition or situation during which the system performs an activity or waits for an event. It is typically represented by a rounded rectangle.
- Transition: The movement from one state to another. This is depicted as an arrow connecting two states.
- Event: A stimulus that triggers a transition. It is the “cause” of the movement.
- Guard Condition: A boolean expression that must be true for a transition to occur. It acts as a filter on the event.
- Action: The activity performed during a transition or while in a state. This can be entry, exit, or internal activity.
- Initial State: The starting point of the diagram, usually a filled circle.
- Final State: The termination point, represented by a filled circle within a larger circle.
Distinguishing Events from Actions ⚡
Confusion often arises between events and actions. An event is the trigger; an action is the result. Consider a door mechanism. The event is “push button”. The action is “unlock motor”. The state changes from “locked” to “unlocked”. Understanding this distinction prevents logic errors where side effects are assumed to happen without explicit definition.
Visual Notation and Syntax 🎨
Standardizing notation ensures that anyone reading the diagram understands the intended logic. While variations exist, the Unified Modeling Language (UML) provides a widely accepted standard.
- States: Drawn as rounded rectangles. The name of the state goes at the top. Optional sub-sections can define entry, do, and exit actions.
- Transitions: Straight or curved lines with arrowheads. The event label sits above the line. Guard conditions are placed in square brackets, e.g., [balance > 0].
- Initial Node: A small solid black circle. A transition originates from here.
- Final Node: A solid black circle surrounded by a ring. No transitions should leave this node.
Deep Dive: Advanced State Concepts 🔍
Simple linear flows are often insufficient for complex systems. Advanced concepts allow for nesting, concurrency, and history tracking. These features add depth to the model without cluttering the logic.
Composite States
When a state contains other states, it becomes a composite state. This allows for hierarchical modeling. For instance, a “Maintenance” state might contain sub-states like “Diagnosis” and “Repair”. This abstraction keeps the high-level diagram clean while retaining detail at the lower level.
- Entry Point: Where the composite state begins.
- Exit Point: Where the composite state terminates.
- Default Transition: The initial state within the composite block.
History States
Sometimes, a system needs to remember where it left off before leaving a state. A history state captures this. When the system re-enters the composite state, it can resume from the specific sub-state it was in previously, rather than resetting to the default.
- Shallow History (H): Remembers the last active sub-state of the immediate parent.
- Deep History (H with circle): Remembers the state deep within nested hierarchies.
Concurrent States
Not all parts of a system move in sync. Concurrency allows multiple state machines to run simultaneously. This is often represented by a vertical bar (fork) that splits into multiple orthogonal regions. For example, a phone might handle “ringing” and “screen on” independently.
Designing Effective Transitions 🔄
The quality of a state diagram depends heavily on how transitions are managed. Poorly defined transitions lead to ambiguous behavior. The following principles guide robust transition design.
- Clarity: Every transition should have a clear label. Avoid generic terms like “go” or “move”.
- Completeness: Ensure all necessary events are covered. If a state cannot handle an event, it should either ignore it or have a defined error path.
- Guard Conditions: Use guards to simplify transition labels. Instead of labeling an arrow “login_success”, label it “login” and add a guard [valid_credentials].
- No Deadlocks: Ensure there is always a path out of every state, unless it is a final state.
- Loop Detection: Watch for infinite loops where the system cycles without progress.
Application Areas 🌍
State diagrams are versatile tools used across various domains. Their application extends beyond simple software logic into hardware and protocol design.
| Domain | Typical Use Case | Benefit |
|---|---|---|
| Embedded Systems | Microcontroller logic, sensor reading | Ensures hardware responds correctly to interrupts |
| Web Applications | User authentication flows, checkout processes | Prevents users from skipping steps or encountering errors |
| Network Protocols | TCP connection states, data packet handling | Standardizes communication reliability |
| Workflow Automation | Approval chains, task management | Visualizes bottlenecks and decision points |
| Game Development | Character AI, level states | Manages complex behavior trees efficiently |
Common Pitfalls and How to Avoid Them ⚠️
Even experienced modelers encounter challenges. Recognizing these common issues helps maintain the integrity of the design.
1. The Spaghetti Diagram
When a diagram becomes too dense with crisscrossing arrows, it loses readability. This often happens when trying to model too many states at once. To fix this, break the system into sub-machines. Use composite states to group related behaviors.
2. Unreachable States
A state is unreachable if no transition leads to it. This usually indicates a design error where a condition was omitted. Review the initial state and ensure every defined state is accessible.
3. Ambiguous Guards
Using vague conditions like “if valid” without defining what valid means creates implementation ambiguity. Guards must be precise. Define the data types and expected values clearly in the documentation.
4. Ignoring Error States
Many models focus on the happy path. However, robust systems must handle failure. Define error states explicitly. For example, if a network request fails, the system should transition to a “retry” or “error” state, not crash.
5. Mixing Concerns
Do not mix logic for different subsystems in the same diagram. If you are modeling a user session and a payment gateway in one state machine, the complexity will explode. Separate concerns into distinct diagrams that interact via events.
Best Practices for Documentation 📝
A diagram is only as good as its accompanying documentation. The visual model provides the structure, but text provides the context.
- Legend: Include a legend if you use non-standard symbols.
- Event List: Provide a separate list of all events used in the diagram with their parameters.
- State Descriptions: Add notes to complex states explaining the internal logic that isn’t visible in the box.
- Version Control: Treat diagrams like code. Track changes over time to understand evolution.
- Review Cycles: Have peers review the diagram before implementation begins. Fresh eyes catch logic gaps.
Comparing State Types for Clarity 📊
Understanding the difference between various state types helps in choosing the right abstraction level. The table below outlines the distinctions.
| State Type | Behavior | Example |
|---|---|---|
| Simple State | Atomic, cannot be decomposed | Idle, Running |
| Composite State | Contains sub-states | Processing (includes Validation) |
| Orthogonal State | Runs concurrently with others | Network Status & User Status |
| Submachine State | References another complete state machine | Refers to a “Login” machine |
Implementation Considerations 💻
Once the design is complete, the transition to implementation requires care. The diagram serves as the specification for the code. The following steps ensure alignment between design and reality.
- Code Structure: Organize code to reflect the state hierarchy. Use classes or modules that mirror the states.
- Event Dispatching: Implement a central dispatcher that routes events to the current state handler.
- Logging: Log state transitions during development. This aids in debugging when the system behaves unexpectedly.
- Testing: Write tests for every transition. Verify that guards prevent invalid moves and actions execute correctly.
- Refactoring: If the system grows, update the diagram. Do not let the code diverge from the model.
Mathematical Underpinnings 🧮
While practical modeling often skips the math, understanding the theory provides a safety net. A finite state machine is formally defined as a 5-tuple: (Q, Σ, δ, q₀, F).
- Q: A finite set of states.
- Σ: A finite set of input symbols (events).
- δ: The transition function that maps a state and input to a new state.
- q₀: The initial state.
- F: The set of final or accepting states.
This formalism guarantees that the system is deterministic if δ is a function, or non-deterministic if it is a relation. In software design, we generally aim for deterministic behavior to ensure reproducibility.
Final Thoughts on Modeling 🧠
Creating a state diagram is an exercise in clarity. It forces the designer to confront every possible condition and reaction. It is not merely a drawing; it is a contract for behavior. By adhering to the principles outlined here, you ensure that your systems are predictable, maintainable, and robust.
The journey from concept to code is smoother when the path is mapped out. Take the time to define your states, refine your transitions, and document your logic. This investment pays off in reduced debugging time and higher system reliability.