Security is often perceived as a set of tools or protocols layered on top of existing systems. While firewalls and encryption are critical, they are reactive measures. True security begins with understanding the architecture itself. One of the most effective ways to visualize and secure system architecture is through Data Flow Mapping. This process involves creating a visual representation of how information moves through a system, identifying where it originates, where it travels, and where it settles.
When applied to security analysis, data flow mapping shifts the perspective from static defense to dynamic observation. It reveals the pathways where vulnerabilities might hide, allowing teams to assess risks before they are exploited. By mapping the journey of data, organizations can enforce stricter controls at the most critical junctions. This approach builds a foundation of trust and integrity within the digital infrastructure.
📊 Understanding Data Flow Diagrams in Security
A Data Flow Diagram (DFD) is a structured representation of a system. It focuses on the movement of data rather than the timing or logic of processes. In a security context, a DFD becomes a blueprint for risk assessment. It answers fundamental questions: Who accesses this data? Where does it go? Is it encrypted at rest? Is it encrypted in transit?
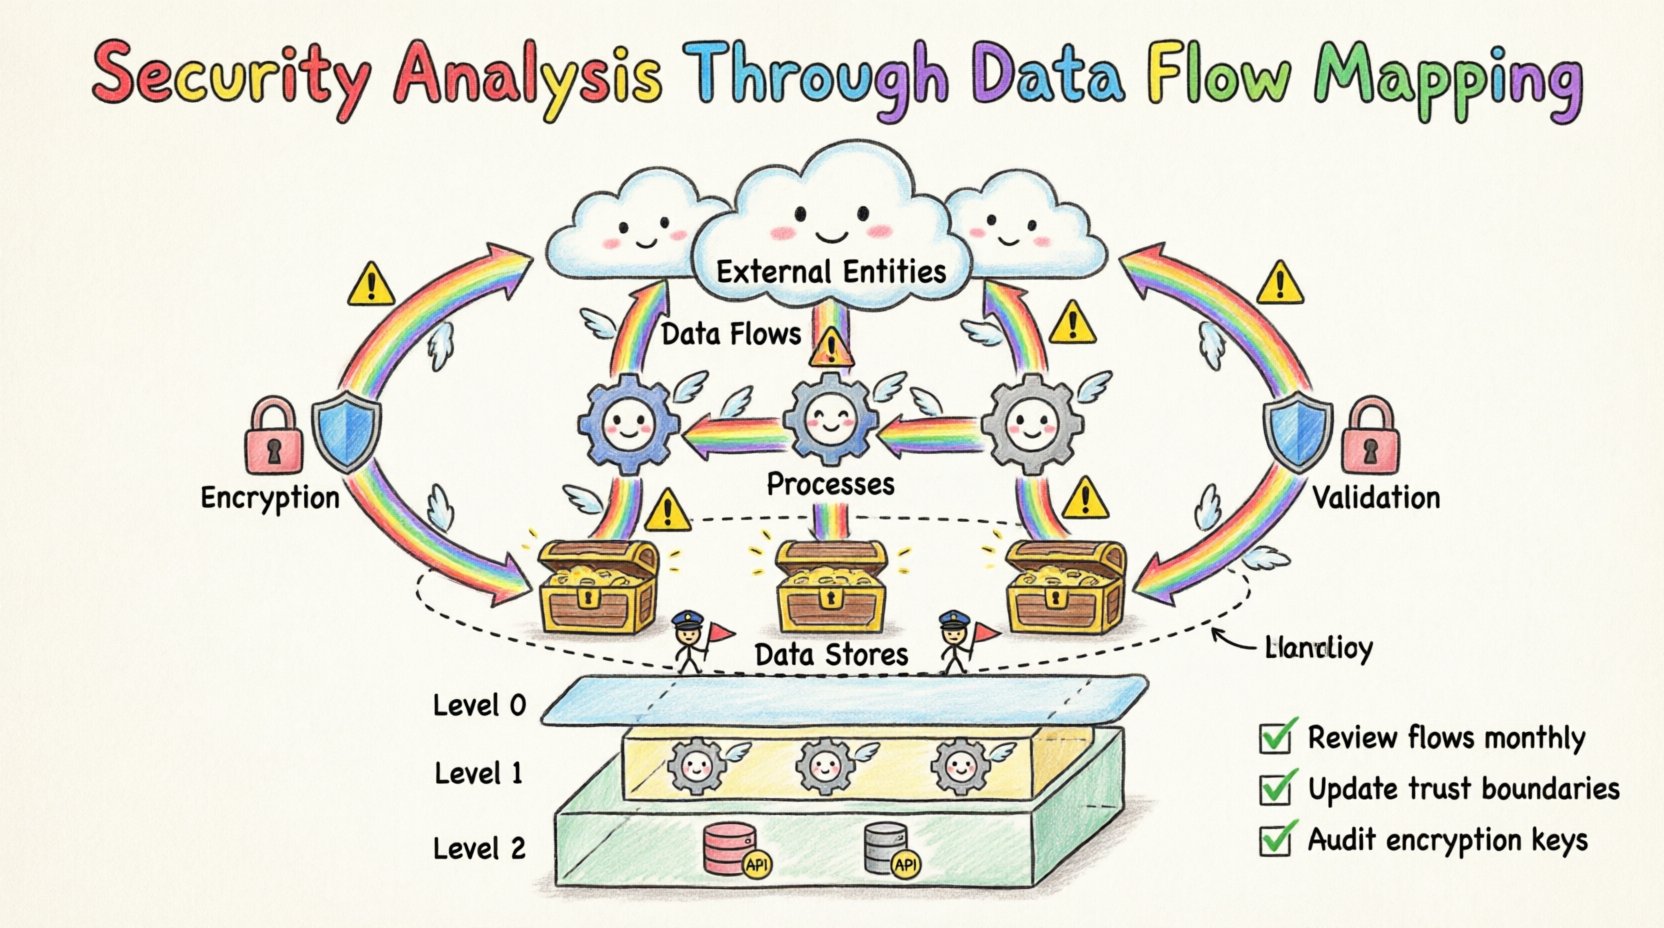
Standard DFDs typically consist of four core components. Each component carries specific security implications when analyzed through a defensive lens.
- External Entities: These are sources or destinations of data outside the system boundary. In security terms, these represent users, clients, or third-party services. Every external entity introduces a potential point of entry for malicious actors. Validating the identity and authorization of these entities is the first line of defense.
- Processes: These are actions that transform data. A process might validate input, calculate a value, or trigger an alert. From a security standpoint, processes are where logic vulnerabilities can exist. If a process fails to sanitize input, it may allow injection attacks. If it fails to log actions, it may allow unauthorized changes to go undetected.
- Data Stores: These are repositories where data rests. Whether a database, a file system, or a memory buffer, data stores are high-value targets. Security analysis here focuses on access control, encryption standards, and backup integrity. Unauthorized access to a data store is often the primary goal of a breach.
- Data Flows: These are the arrows connecting the components, representing the movement of data. This is the most critical element for security mapping. Data flows must be scrutinized for exposure. Does sensitive data travel over an unencrypted channel? Does it pass through a less trusted environment without validation? Every flow represents a potential interception point.
🔍 The Methodology of Mapping for Security
Creating a secure data flow map requires a structured approach. It is not enough to draw lines between boxes. The map must reflect the actual logic and security controls in place. This process usually follows a top-down decomposition strategy.
Step 1: Define the Scope and Boundary
Begin by establishing the system boundary. What is inside the system, and what is outside? This distinction defines where security controls must be enforced. Anything outside the boundary is assumed to be untrusted. The perimeter between the internal system and external entities is where authentication and authorization checks must occur.
Step 2: Identify the External Entities
List every user, system, or device that interacts with the application. Categorize them by trust level. Internal services might be trusted more than public-facing APIs. This classification helps prioritize security monitoring. High-trust entities still require verification, but the scrutiny level differs from public clients.
Step 3: Map the Data Flows
Trace the path of data from entry to exit. Start with the initial input, such as a login request or a file upload. Follow the data through every transformation and storage point. Ensure every arrow has a label describing the data type. This is where you identify if sensitive information like passwords or credit card numbers are being exposed in logs or error messages.
Step 4: Label Data Sensitivity
Not all data requires the same level of protection. Classify data flows based on sensitivity. Public data, internal business data, and regulated data each have different security requirements. Mark flows containing regulated data (such as health records or personal identification) with specific handling protocols. This ensures compliance with legal frameworks without over-engineering public data handling.
Step 5: Identify Trust Boundaries
Trust boundaries are logical barriers where the level of security control changes. A typical boundary exists between a client application and a server. Another might exist between a web server and a database server. Crossing a trust boundary requires validation, encryption, and often authentication. Map these boundaries clearly to ensure no flow crosses without appropriate checks.
⚠️ Identifying Risks Through Flow Analysis
Once the map is complete, the next phase is risk identification. This involves looking at the diagram and asking what could go wrong at each node and connection. This technique is often aligned with threat modeling methodologies.
Key Risk Categories
| Risk Category |
Description |
DFD Indicator |
| Unauthorized Access |
Data is accessed by entities not permitted to view it. |
Flows originating from low-trust entities without authentication nodes. |
| Data Tampering |
Data is altered during transit or storage. |
Flows lacking integrity checks or digital signatures. |
| Information Disclosure |
Sensitive data is revealed to unauthorized parties. |
Flows passing through public networks without encryption labels. |
| Denial of Service |
Systems become unavailable due to resource exhaustion. |
Processes with no input validation or rate limiting indicators. |
| Elevation of Privilege |
Users gain access beyond their assigned rights. |
Processes that handle admin functions without role checks. |
Analyzing the diagram against these categories helps pinpoint weak spots. For instance, if a data flow moves from a user interface directly to a database without an intermediate process, it suggests a lack of business logic validation. This is a significant risk for injection attacks. Similarly, if a data store contains credentials but the flow to that store does not indicate encryption, the storage mechanism is likely vulnerable.
🔒 Enhancing Security via Boundary Controls
The primary goal of security analysis on a data flow map is to strengthen boundaries. Every time data crosses a boundary, the risk increases. Therefore, the map should guide the implementation of strict controls at these intersections.
Encryption Requirements
Every data flow crossing a trust boundary should be encrypted. The map should explicitly denote where encryption is required. This includes transport layer encryption for data in transit and application layer encryption for data in motion between services. If a flow is marked as “Public,” it may not need encryption, but it must be audited for sensitivity. If a flow is marked as “Sensitive,” encryption is mandatory.
Input Validation
Processes are the gatekeepers of data integrity. The map should highlight where validation occurs. If a process receives data from an external entity, it must validate the format, length, and content of that data. This prevents malformed data from corrupting the system or triggering vulnerabilities. The DFD should show validation checkpoints before data enters a data store.
Logging and Monitoring
Security is not just prevention; it is detection. Data flows should indicate where logging occurs. Critical processes should generate audit trails. If a data flow involves a financial transaction, the DFD should show a process that records the transaction details for future review. This ensures that if a breach occurs, the investigation can trace the path of the attacker.
📑 Managing Complexity with Levels
As systems grow, a single diagram becomes too complex to be useful. To manage this, security analysts use levels of abstraction. This allows for detailed analysis without overwhelming the initial overview.
- Level 0 (Context Diagram): Shows the system as a single process and its interaction with external entities. This is used for high-level security scope definition. It answers: What is the system, and who talks to it?
- Level 1: Decomposes the main process into sub-processes. This level is useful for identifying major security boundaries and data stores. It breaks down the system into functional modules.
- Level 2: Further decomposes Level 1 processes. This level is necessary for detailed security control implementation. It reveals the specific data transformations and storage mechanisms within complex modules.
Using multiple levels ensures that security teams can focus on the right granularity. A high-level manager might review the Level 0 diagram to understand the risk profile. A developer might review the Level 2 diagram to ensure their specific function handles data securely. This hierarchy prevents security oversight in complex architectures.
🔄 Maintenance and Iteration
A data flow map is not a one-time deliverable. Systems evolve. New features are added, and old components are retired. If the map does not reflect the current state, security analysis becomes inaccurate. An outdated map might suggest a secure path that is now exposed or hide a new vulnerability introduced by a recent change.
Organizations should treat the data flow map as a living document. It should be updated whenever the architecture changes. This includes updating the map during the design phase of new features. By integrating the map into the development lifecycle, security becomes a continuous activity rather than a final gate.
Best Practices for Maintenance:
- Version Control: Store the diagrams in a repository alongside the code. This ensures that the map matches the deployment version.
- Review Cycles: Schedule regular reviews of the data flow map. Quarterly reviews are often sufficient for stable systems, while rapidly changing systems may need monthly updates.
- Stakeholder Involvement: Ensure architects, developers, and security analysts all have access to the latest version. Discrepancies between the map and the code are a red flag for security debt.
🛡️ Compliance and Audit Support
Regulatory frameworks often require organizations to demonstrate how they protect data. Standards like GDPR, HIPAA, or PCI-DSS mandate data protection measures. A well-maintained data flow map serves as strong evidence during audits.
When an auditor asks how data is protected, the map provides a visual answer. It shows the path of the data and the controls applied at each step. This reduces the time spent gathering evidence and clarifies the security posture to stakeholders. It also helps identify gaps where compliance might be lacking, allowing the organization to remediate issues before an audit occurs.
For example, if a regulation requires data to be encrypted at rest, the map should show the data store and indicate that encryption is active. If the regulation requires data to be deleted after a certain period, the map should show the retention process. This alignment between documentation and reality builds trust with regulators and customers alike.
🚀 Conclusion
Security analysis through data flow mapping is a foundational practice for building resilient systems. It moves the conversation from abstract concepts to concrete architecture. By visualizing the movement of data, teams can identify risks early and enforce controls where they matter most.
This approach does not replace other security measures. It complements them by providing the context needed to apply tools effectively. A firewall is more effective when you know exactly which traffic flows it should inspect. Encryption is more useful when you know exactly where sensitive data travels. Data flow mapping provides that context.
Investing time in creating and maintaining accurate diagrams pays dividends in risk reduction. It transforms security from a reactive burden into a proactive strategy. As systems become more distributed and complex, the clarity provided by data flow mapping becomes even more valuable. It remains one of the most reliable methods for ensuring that data remains secure throughout its lifecycle.