Strategic planning requires a foundation built on accurate information. When applying the Porter’s Five Forces framework, the quality of the resulting analysis depends entirely on the quality of the data gathered. A model is only as strong as the intelligence supporting it. This guide outlines the specific sources and methodologies required to collect robust data for each of the five competitive forces. We will explore where to look, how to verify, and what metrics matter most for reliable industry research.
🔍 The Foundation of Reliable Data
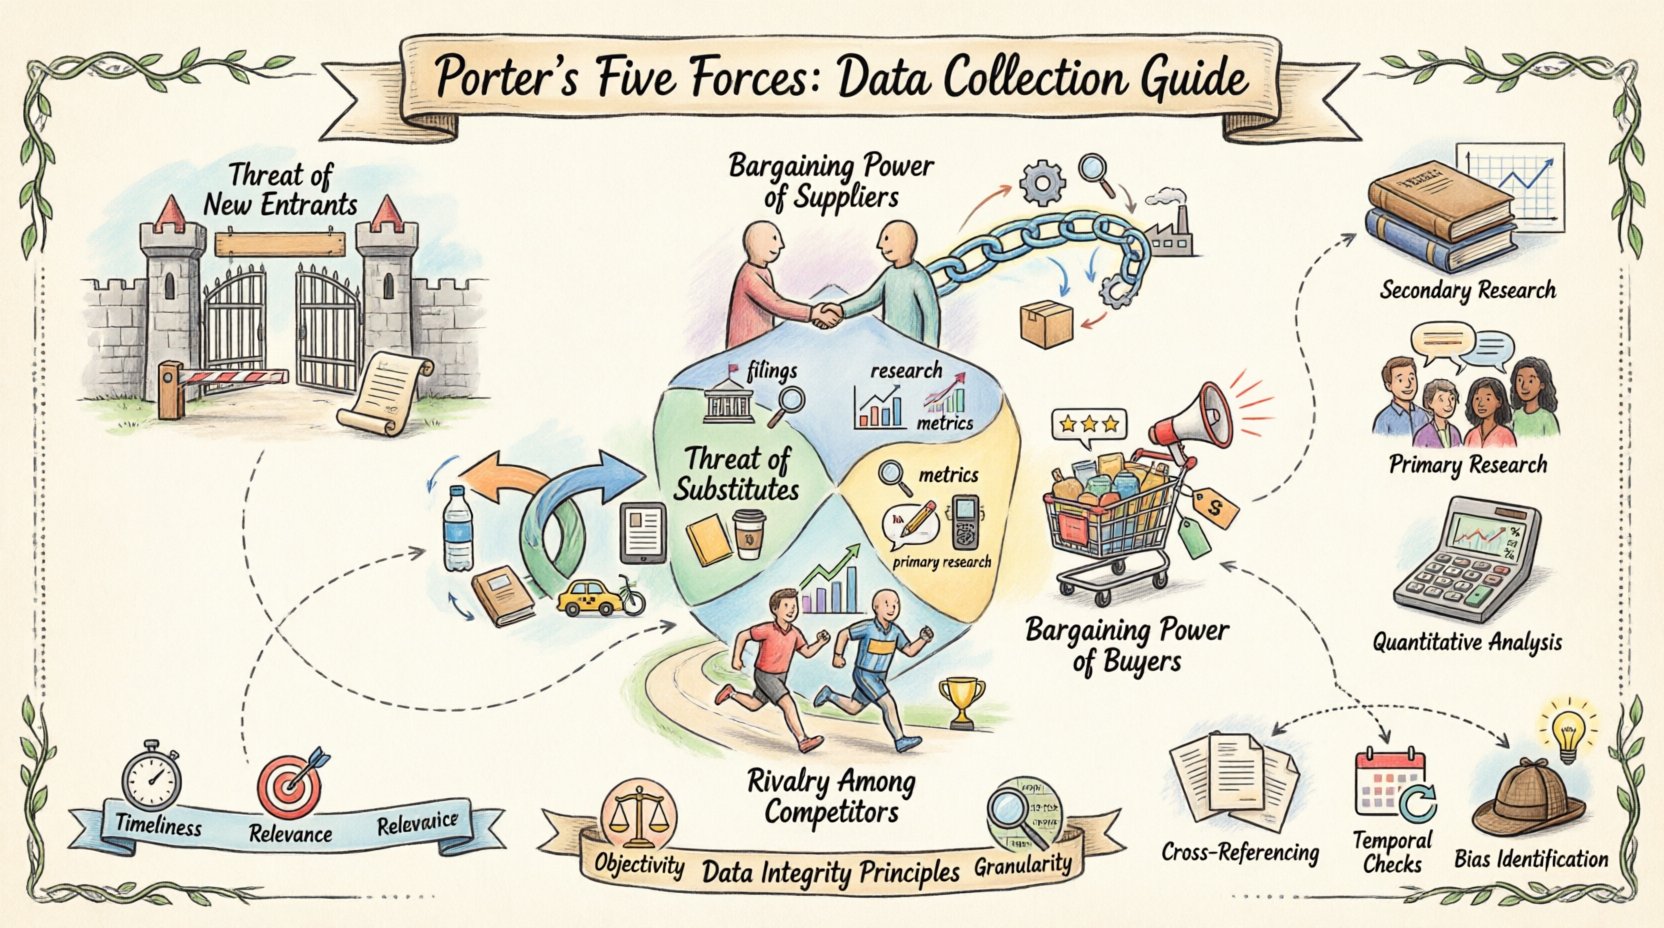
Before diving into specific forces, it is essential to establish principles for data integrity. Inconsistent or outdated information can lead to flawed strategic decisions. Reliable research involves triangulating data from multiple independent sources to confirm findings. This approach reduces the risk of bias inherent in single-source reporting.
Key principles for your data collection process include:
- Timeliness: Ensure all data reflects the current market conditions. Historical data is useful for trend analysis but may not predict immediate shifts.
- Relevance: Focus on metrics that directly impact the specific forces you are analyzing. Avoid gathering data that does not inform the strategic question.
- Objectivity: Seek out neutral third-party sources rather than relying solely on promotional materials from competitors.
- Granularity: Broad industry averages often mask specific risks. Drill down into regional or segment-level data when possible.
🚪 Force 1: Threat of New Entrants
This force examines the ease with which new competitors can enter the market. High barriers to entry protect existing market share, while low barriers invite disruption. Data collection here focuses on identifying obstacles and the cost of overcoming them.
📝 Data Points to Gather
- Capital requirements for establishing operations.
- Regulatory licensing and compliance costs.
- Access to distribution channels.
- Proprietary technology or patent restrictions.
- Economies of scale currently enjoyed by incumbents.
📚 Recommended Sources
- Government Filings: Regulatory bodies publish lists of requirements for specific industries, such as healthcare, finance, or telecommunications.
- Industry Associations: Membership directories and white papers often detail entry thresholds and certification processes.
- Financial Records: Public company reports provide insight into the capital expenditure needed to scale operations in the sector.
- Patent Databases: Search for active patents that might block new technological entrants.
📊 Entry Barrier Assessment Table
| Barrier Type | Data Indicator | Source Example |
|---|---|---|
| Capital | Minimum investment required | Startup cost surveys |
| Regulation | Licensing timeline | Government agency portals |
| Tech | Patent count/complexity | IP Office databases |
| Scale | Cost per unit vs. volume | Cost accounting reports |
🤝 Force 2: Bargaining Power of Suppliers
Supplier power is determined by the concentration of the supply base and the uniqueness of their offerings. If a company relies on a single source for a critical component, that supplier holds significant leverage. Data collection must quantify this dependency.
📝 Data Points to Gather
- Number of available suppliers in the market.
- Concentration ratio of the top suppliers.
- Switching costs for the buyer.
- Availability of substitute inputs.
- Forward integration threats (suppliers entering the market).
📚 Recommended Sources
- Procurement Data: Aggregated purchasing data from industry buyers reveals who controls the supply chain.
- Trade Publications: Reports often highlight supplier consolidation trends and mergers.
- Supply Chain Reports: Logistics and sourcing firms publish data on raw material availability and pricing volatility.
- Supplier Financials: Analyzing the profitability and market cap of top suppliers indicates their stability and power.
💡 Supplier Concentration Analysis
To assess power, calculate the share of the market controlled by the top four suppliers. If this number exceeds 60%, the industry is likely oligopolistic, and supplier power is high. This calculation requires sales volume data from multiple industry participants.
🛒 Force 3: Bargaining Power of Buyers
Buyers exert power when they can drive prices down or demand higher quality. This force is influenced by buyer volume, product differentiation, and the availability of alternatives. Understanding buyer sentiment is crucial.
📝 Data Points to Gather
- Volume concentration of major buyers.
- Price sensitivity and elasticity.
- Switching costs for customers.
- Backward integration potential (buyers entering the market).
- Profitability of the buyer’s industry.
📚 Recommended Sources
- Customer Surveys: Direct feedback on pricing tolerance and satisfaction levels provides primary data.
- Sales Data: Analysis of purchase frequency and average order value helps determine dependency.
- Market Research: Third-party reports often segment buyers by industry or region.
- Competitor Pricing: Monitoring price changes across competitors reveals buyer reaction to cost increases.
🔎 Buyer Power Indicators
High buyer power is indicated when customers purchase in large volumes relative to the seller’s total revenue. If a single client represents more than 10% of a company’s sales, that client has significant leverage. Tracking customer churn rates also provides insight into how easily buyers can leave.
🔄 Force 4: Threat of Substitutes
Substitutes are products from different industries that satisfy the same need. For example, video conferencing software is a substitute for business travel. This force measures the price-performance trade-off of alternatives.
📝 Data Points to Gather
- Price-performance ratio of alternatives.
- Switching costs for the customer.
- Trends in consumer behavior regarding new technologies.
- Availability of substitute products globally.
- Regulatory changes affecting alternatives.
📚 Recommended Sources
- Consumer Trend Reports: These highlight shifting preferences and emerging technologies.
- Patent Filings: Look for innovation in adjacent industries that could disrupt the current model.
- Market Growth Data: Compare the growth rate of the main industry against substitute categories.
- Technology Roadmaps: Understand where adjacent tech sectors are heading.
📊 Substitution Risk Matrix
| Factor | High Risk Indicator | Low Risk Indicator |
|---|---|---|
| Price | Substitute is significantly cheaper | Substitute is significantly more expensive |
| Performance | Substitute meets all core needs | Substitute lacks key features |
| Switching Cost | Low friction to change | High friction to change |
🏆 Force 5: Rivalry Among Competitors
This force assesses the intensity of competition within the industry. High rivalry leads to price wars and reduced profitability. Data collection here focuses on market structure and competitor behavior.
📝 Data Points to Gather
- Number and size of competitors.
- Industry growth rate.
- Fixed costs and exit barriers.
- Differentiation levels.
- Information transparency among competitors.
📚 Recommended Sources
- Annual Reports: Competitor filings reveal strategic shifts and financial health.
- News Aggregators: Monitor press releases for mergers, acquisitions, or new product launches.
- Job Postings: Hiring trends indicate expansion or contraction in competitor organizations.
- Trade Show Attendance: Presence at industry events signals commitment and resource allocation.
🛠️ Methods for Collection
Gathering this data requires a mix of approaches. Relying on a single method often results in gaps. Combining quantitative metrics with qualitative insights yields the most complete picture.
📄 Secondary Research
This involves analyzing existing data published by others. It is cost-effective and provides a broad overview. Good sources include:
- Government census and economic data.
- Academic journals and case studies.
- Industry association publications.
- Financial news outlets and analyst reports.
🗣️ Primary Research
When public data is insufficient, direct engagement is necessary. This includes:
- Expert Interviews: Speak with industry veterans to understand nuances not found in reports.
- Customer Interviews: Ask buyers about their decision-making process and pain points.
- Supplier Interviews: Understand capacity constraints and pricing models.
- Observational Studies: Visit retail locations or service centers to gauge customer volume and experience.
📉 Quantitative Analysis
Numerical data must be standardized for comparison. This includes:
- Market share percentages.
- Revenue growth rates.
- Profit margins.
- Unit costs.
✅ Validation and Accuracy
Once data is collected, it must be validated. Assumptions made during collection can introduce error. Validation ensures the data supports the strategic conclusions.
🔍 Cross-Referencing
Verify figures by checking them against at least two other independent sources. If a financial report claims a specific growth rate, check if competitor reports or industry averages align with that figure.
📅 Temporal Checks
Ensure data is not stale. Economic conditions change rapidly. A report from three years ago regarding supplier prices may no longer be accurate due to inflation or supply chain shifts.
🧠 Bias Identification
Be aware of the source’s motivation. Marketing materials will exaggerate strengths. Financial filings will minimize risks. Adjust your interpretation accordingly to find the underlying truth.
⚠️ Common Pitfalls to Avoid
Even experienced analysts can stumble during data collection. Awareness of common mistakes helps maintain rigor.
- Ignoring Regional Variations: A global average may hide local monopolies or saturated markets. Always segment data by geography.
- Over-Reliance on Estimates: Rough guesses are better than nothing, but specific numbers from audited sources are superior.
- Missing Qualitative Context: Numbers tell the “what,” but interviews explain the “why.” Combine both.
- Static Analysis: Treat the data as a snapshot. Industry dynamics are fluid. Update findings regularly.
- Negating Exit Barriers: Often overlooked, high exit barriers (like specialized assets) can trap competitors in a market, increasing rivalry.
📝 Organizing Your Research
Finally, structure the collected information for easy retrieval and review. A disorganized dataset is difficult to analyze effectively.
- Centralized Repository: Store all documents and data points in a single, secure location.
- Metadata Tags: Tag data by force, date, source reliability, and region.
- Version Control: Keep track of updates to ensure you are analyzing the most recent information.
- Summary Sheets: Create high-level dashboards that summarize key metrics for each force.
📈 Final Thoughts on Data Strategy
Building a comprehensive view of your industry landscape takes time and diligence. The effort invested in data collection directly correlates to the quality of the strategic plan. By utilizing diverse sources and adhering to rigorous validation methods, you ensure that your analysis of Porter’s Five Forces is grounded in reality. This approach minimizes risk and maximizes the utility of your strategic planning process.
Remember that data collection is not a one-time event. Markets evolve, and so should your information gathering. Regularly revisiting these sources keeps your organization agile and informed.