Understanding the dynamics of an industry is critical for any organization aiming to sustain profitability and competitive advantage. The Porter’s Five Forces Analysis provides a structured method to evaluate these dynamics. Developed by Michael E. Porter in 1979, this framework remains a cornerstone of strategic management. It examines the competitive intensity and attractiveness of a market through five specific forces. By analyzing these factors, businesses can identify where power lies, assess profit potential, and formulate strategies that withstand market pressures. This guide offers a detailed examination of each force, the process of implementation, and how to interpret the findings for long-term planning.
Origins of the Framework 📜
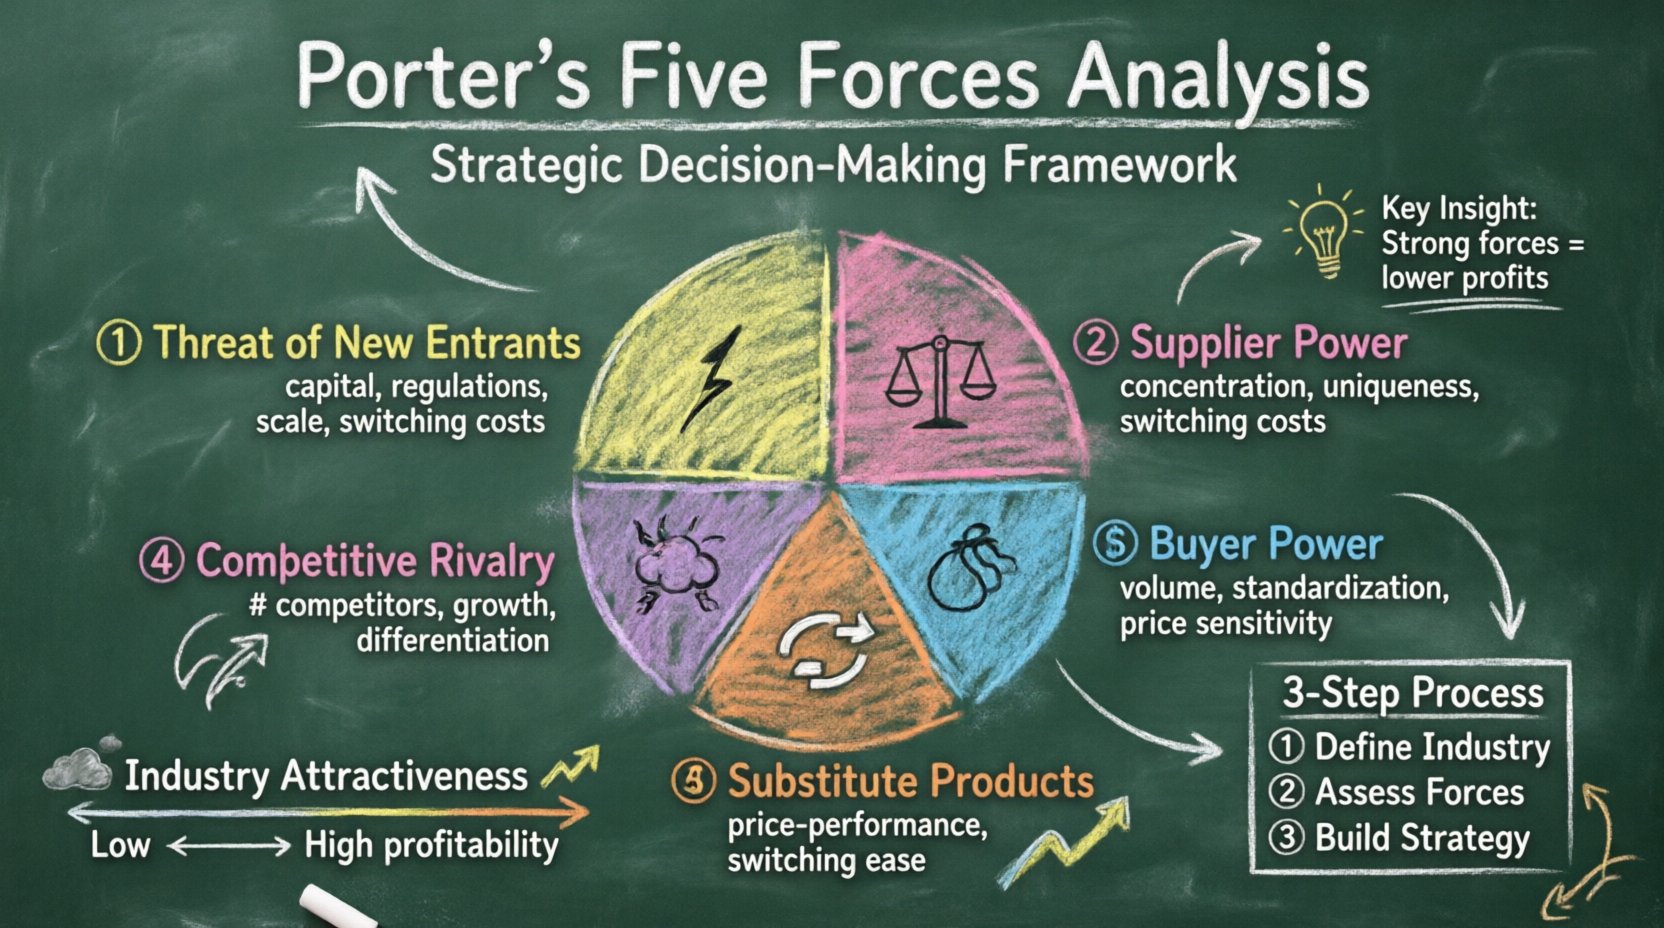
Michael Porter introduced this concept in his Harvard Business Review article, “How Competitive Forces Shape Strategy.” Prior to this, much of strategic thinking focused on internal capabilities. Porter shifted the focus outward to the industry structure. He argued that the profit potential of a firm is determined by the industry it operates in. The framework helps managers understand the source of competition. It moves beyond simple competitor analysis to look at the underlying economic structure of the business environment.
The model suggests that the five forces collectively determine the intensity of competition. This intensity directly impacts the potential for profit. If the forces are strong, profits tend to be low. If the forces are weak, profits can be higher. This insight allows leaders to make informed decisions about market entry, exit, or expansion.
The Five Forces Explained 🧩
Each force represents a different dimension of competitive pressure. A thorough analysis requires looking at all five areas. Ignoring one can lead to a skewed view of the market. Below is a detailed breakdown of each component.
1. Threat of New Entrants 🚀
This force assesses how easy or difficult it is for new competitors to enter the market. If entry is easy, existing players face constant pressure to lower prices or increase innovation. High barriers to entry protect the profits of current incumbents. Barriers can take many forms:
- Capital Requirements: Industries requiring significant investment, such as aerospace or telecommunications, naturally limit new players. Access to funding is a primary hurdle.
- Regulatory Policies: Government licenses, patents, and safety standards can block entry. Pharmaceutical companies rely heavily on patent protection.
- Economies of Scale: Large companies often produce goods at a lower cost per unit. New entrants struggle to match these prices without significant volume.
- Switching Costs: If customers face high costs to switch to a new provider, they are less likely to do so. This includes data migration, training, or contract penalties.
- Access to Distribution Channels: If established firms control the primary routes to market, new entrants may struggle to get their products to customers.
When the threat of new entrants is high, profitability is generally suppressed. Companies must invest heavily in defense strategies, such as building brand loyalty or securing exclusive partnerships.
2. Bargaining Power of Suppliers ⚖️
Suppliers can exert pressure on companies by raising prices or reducing the quality of goods and services. This force examines the relationship between the firm and its upstream providers. Supplier power increases when:
- Concentration: There are few suppliers relative to the number of buyers. A monopoly supplier has significant leverage.
- Uniqueness: If the supplied input is specialized or differentiated, buyers cannot easily find alternatives.
- Switching Costs: If changing suppliers requires retooling or significant investment, buyers remain dependent on the current provider.
- Threat of Forward Integration: Suppliers may threaten to enter the buyer’s industry themselves. This threat gives them leverage in negotiations.
High supplier power allows providers to capture more value, reducing the margin available to the buying company. Strategies to mitigate this include sourcing from multiple suppliers, backward integration, or developing substitute inputs.
3. Bargaining Power of Buyers 💰
Buyers can drive down prices or demand higher quality. This force looks at the customers who purchase the company’s output. Buyer power is high when:
- Volume: Customers purchase in large quantities. Large retailers like Walmart have significant leverage over manufacturers.
- Standardization: If the product is undifferentiated, buyers will simply choose the lowest price. Commodities are the prime example.
- Switching Costs: Low switching costs make it easy for customers to leave for a competitor.
- Price Sensitivity: If the product represents a significant portion of the buyer’s costs, they will negotiate harder.
- Information Availability: When buyers are well-informed about market prices and alternatives, they can negotiate more effectively.
When buyers have strong bargaining power, margins shrink. Companies must focus on differentiation, brand strength, or customer service to reduce this power.
4. Threat of Substitute Products 🔀
Substitutes are products from other industries that satisfy the same need. They limit the price a company can charge. For example, video conferencing is a substitute for business travel. This force considers:
- Relative Price-Performance: If a substitute offers better value for money, customers will switch.
- Switching Costs: As with other forces, if switching to a substitute is difficult, the threat is lower.
- Buyer Propensity to Substitute: Some customers are naturally more open to trying new solutions than others.
- Perceived Quality: If the substitute is seen as inferior, the threat remains low even if the price is lower.
Ignoring substitutes is a common strategic error. Companies must monitor adjacent industries for innovations that could render their core offering obsolete.
5. Competitive Rivalry Among Existing Firms 🥊
This force measures the intensity of competition between current players. It is often the most visible force. Rivalry is intense when:
- Number of Competitors: Many competitors of similar size lead to price wars and aggressive marketing.
- Industry Growth: In stagnant markets, companies fight for market share. In growing markets, they can grow together.
- Exit Barriers: If it is expensive or difficult to leave the industry (e.g., specialized assets), firms stay and compete fiercely.
- Differentiation: Low differentiation leads to price-based competition.
- Capacity Increases: When capacity is added faster than demand, prices drop.
High rivalry erodes profitability across the entire industry. Strategies include niche targeting, cost leadership, or focusing on customer loyalty.
Conducting the Analysis 📝
Implementing this framework requires a systematic approach. It is not enough to guess; data must be gathered. Follow these steps to ensure accuracy.
- Define the Industry: Clearly specify the boundaries. Are you analyzing the automotive industry, or specifically electric vehicles? Scope matters.
- Gather Data: Collect information on market size, key players, regulatory environments, and customer trends.
- Assess Each Force: Evaluate the strength of each force. Is it low, medium, or high? Use internal data and external research.
- Identify Strategic Issues: Pinpoint the specific threats and opportunities revealed by the analysis.
- Formulate Strategy: Develop actions to mitigate threats or exploit opportunities. This might involve cost reduction, differentiation, or vertical integration.
A table can help summarize the assessment process.
| Force | Key Question | Indicators of High Power |
|---|---|---|
| Threat of New Entrants | How easy is it to enter? | Low capital, few regulations, low switching costs |
| Bargaining Power of Suppliers | Can suppliers raise prices? | Concentrated suppliers, unique inputs, high switching costs |
| Bargaining Power of Buyers | Can buyers force lower prices? | Large volume, standardized products, low switching costs |
| Threat of Substitutes | Are there alternatives? | High price-performance ratio, low switching costs |
| Competitive Rivalry | How fierce is the fight? | Many competitors, slow growth, high exit barriers |
Interpreting Industry Attractiveness 📉
The result of the analysis is a judgment on the industry’s profit potential. This is often visualized as a spectrum from unattractive to attractive.
- High Attractiveness: Low intensity in all five forces. This environment allows for sustained high returns. Companies should aim to enter or expand here.
- Medium Attractiveness: Mixed intensity. Some forces are strong, others weak. Companies must focus on specific niches or operational efficiencies.
- Low Attractiveness: High intensity across most forces. Margins are thin. Companies should consider exiting or restructuring significantly.
It is important to note that a company can still be profitable in an unattractive industry if it possesses a unique competitive advantage. However, the structural headwinds make success harder.
Limitations and Considerations ⚠️
While powerful, the framework is not without flaws. Strategic planners must be aware of these constraints.
- Static Snapshot: The analysis represents a point in time. Industries change rapidly. A static view may miss emerging trends.
- Focus on Industry: It looks at external factors but may underestimate internal capabilities. A strong company can overcome weak industry forces.
- Complements: The original model does not explicitly account for complementary products. The value of a product often depends on the availability of complements (e.g., software and hardware).
- Global Dynamics: In a globalized economy, local industry structures may differ significantly from national assessments.
To address these limitations, the analysis should be updated regularly. It works best when combined with other strategic tools.
Integration with Other Strategic Tools 🧩
Porter’s Five Forces is rarely used in isolation. It pairs well with other frameworks to provide a holistic view.
SWOT Analysis
The Five Forces feed directly into the Opportunities and Threats sections of a SWOT analysis. The internal strengths and weaknesses are then matched against these external findings.
PESTLE Analysis
PESTLE (Political, Economic, Social, Technological, Legal, Environmental) examines the macro-environment. This provides context for the Five Forces. For instance, a change in laws (Legal) might increase the threat of new entrants.
Value Chain Analysis
While Five Forces looks at the market, Value Chain looks at internal activities. Combining them helps identify where value is created and where costs can be reduced to counter industry pressures.
Real-World Application Examples 🌍
To illustrate the practical utility, consider the airline industry. It typically exhibits high rivalry, low bargaining power of buyers (due to price sensitivity), high threat of substitutes (trains, video conferencing), and moderate supplier power (aircraft manufacturers). This structure explains why the industry historically struggles with profitability.
Conversely, consider the soft drink industry. It has high brand loyalty (low buyer power), high barriers to entry (distribution and brand equity), and low supplier power (sugar, water are commoditized). This results in higher profitability for the major players.
Final Thoughts on Strategic Application 🧭
Using this framework requires discipline. It is not a magic bullet. It demands honest assessment of data. Leaders must avoid confirmation bias. The goal is to see the market as it is, not as one wishes it to be. By understanding the structural forces, organizations can position themselves to navigate challenges. They can decide where to play and how to win.
Strategic decision-making is about resource allocation. Knowing which forces are strongest helps direct investment. Should money go toward R&D to beat substitutes? Should it go toward marketing to build barriers against entrants? The analysis provides the answers.
Ultimately, the value lies in the conversation it sparks. It aligns leadership teams on the reality of the competitive landscape. When everyone understands the pressures, the organization can respond with unity and speed. This shared understanding is a competitive advantage in itself.