Software development is a complex process that requires precision, clarity, and structured planning. One of the foundational tools that supports this structure is the Data Flow Diagram (DFD). When integrated effectively into the Software Development Life Cycle (SDLC), DFDs provide a visual representation of how data moves through a system. This integration ensures that requirements are understood, processes are optimized, and the final product aligns with user needs.
This guide explores the technical aspects of embedding DFDs into every phase of development. It covers the fundamental components, the specific phases of the SDLC where they apply, and the practical steps for maintaining accuracy throughout the project lifecycle.
Understanding Data Flow Diagrams 🧩
A Data Flow Diagram is a graphical representation of the flow of data through an information system. Unlike a flowchart, which focuses on the logic of control flow, a DFD focuses on the movement of data. It depicts where data originates, where it is processed, where it is stored, and where it exits the system.
The core components of a DFD include:
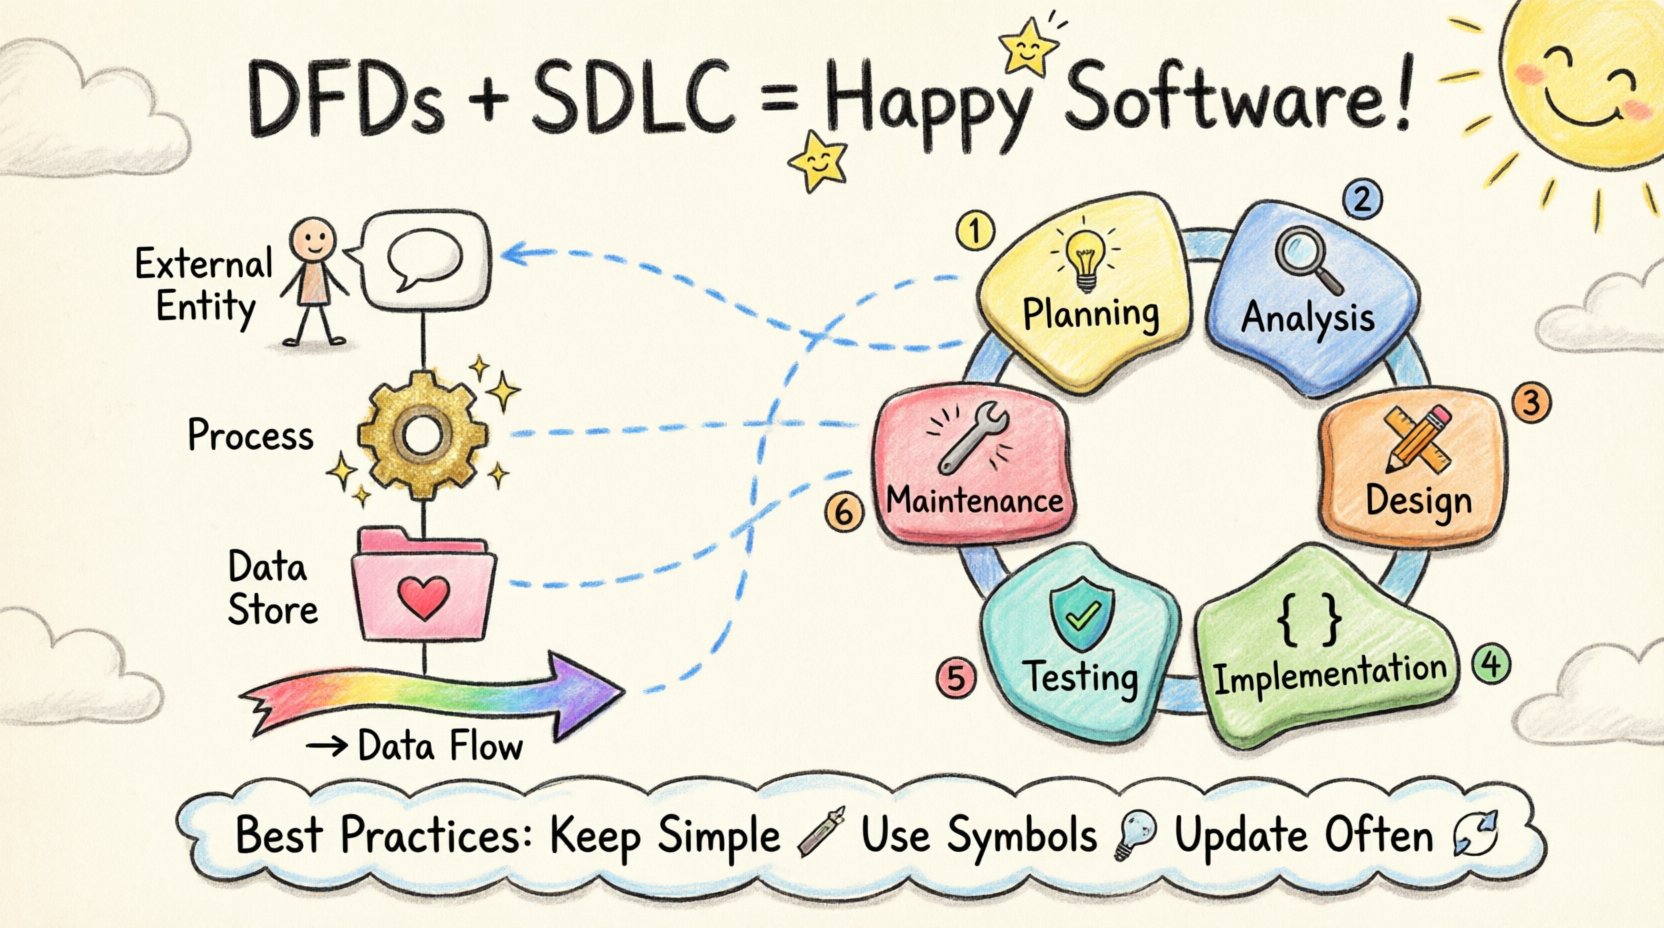
- External Entities: Sources or destinations of data outside the system (e.g., users, other systems). 🧑💻
- Processes: Transformations or manipulations of data (e.g., calculating a total, validating an input). ⚙️
- Data Stores: Where data is held for later use (e.g., databases, files). 📂
- Data Flows: The movement of data between entities, processes, and stores, represented by arrows. ➡️
DFDs are typically created in levels, moving from high-level abstraction to detailed specifics. This hierarchy helps stakeholders understand the system at varying depths of detail.
The SDLC Context 🔄
The Software Development Life Cycle consists of distinct phases designed to manage the creation of software. Integrating DFDs requires understanding where they fit within this timeline. Each phase has specific deliverables, and DFDs serve as artifacts that bridge communication between technical teams and stakeholders.
The standard phases include:
- Planning: Defining the scope and feasibility.
- Analysis: Gathering requirements and understanding business needs.
- Design: Architecting the system structure and interfaces.
- Implementation: Writing the actual code.
- Testing: Verifying functionality and performance.
- Maintenance: Updating and fixing the system post-deployment.
Integrating DFDs in the Planning Phase 📝
During the planning phase, the goal is to determine if the project is viable. A high-level DFD, often called a Context Diagram, is created here. This diagram shows the entire system as a single process and identifies the external entities interacting with it.
By visualizing the system boundaries early, teams can identify the scope of work. This prevents scope creep later in the project. The Context Diagram answers the question: “What data enters and leaves the system?”
Benefits in Planning:
- Clarifies system boundaries immediately. 🚧
- Helps identify key stakeholders and their data interactions.
- Provides a baseline for feasibility studies.
Integrating DFDs in the Analysis Phase 🔍
The analysis phase is where requirements are gathered in detail. This is the most critical stage for DFDs. The Context Diagram is decomposed into a Level 0 DFD, which breaks the main process into major sub-processes. This is often followed by Level 1 DFDs, which break down Level 0 processes further.
At this stage, developers and business analysts work together to ensure the data flow matches business logic. Every data store and process must be justified by a requirement. If a data flow exists without a defined purpose, it represents technical debt or confusion.
Key Activities:
- Identify all inputs and outputs for each sub-process.
- Define the structure of data stored in repositories.
- Ensure data integrity and consistency across flows.
A table can help visualize the mapping between requirements and DFD components:
| DFD Component |
Requirement Association |
Validation Method |
| External Entity |
Stakeholder Role |
Interview / Survey |
| Process |
Functional Requirement |
Use Case Review |
| Data Store |
Non-Functional Requirement |
Schema Review |
| Data Flow |
Interface Specification |
API Documentation |
Integrating DFDs in the Design Phase 🏗️
Once requirements are stable, the design phase begins. Here, the logical DFDs are translated into physical designs. The data flows become API endpoints or database queries. The data stores become database schemas.
It is crucial to maintain the DFD during design. If the architecture changes, the DFD must be updated to reflect the new reality. This ensures that developers are building what was agreed upon. A mismatch between the design diagram and the implementation leads to bugs and rework.
Design Considerations:
- Normalization: Ensure data stores are structured efficiently.
- Security: Identify where sensitive data flows and apply encryption or access controls. 🔒
- Performance: Analyze data flow bottlenecks before coding begins.
Integrating DFDs in Testing and Maintenance 🛠️
Testing is not just about finding bugs; it is about verifying that data behaves as expected. DFDs serve as a checklist for test cases. For every data flow, there should be a test case that validates the input, the processing, and the output.
In the maintenance phase, changes are inevitable. A new feature might require a new data store or a modification to an existing process. Without an updated DFD, developers may break dependencies they cannot see. Keeping the DFD current acts as a living document of the system’s architecture.
Maintenance Workflow:
- Receive change request.
- Update the relevant DFD level.
- Identify impacted processes and data stores.
- Notify development and testing teams.
- Execute updated test cases.
Best Practices for Integration 🎯
To ensure DFDs add value rather than becoming administrative overhead, follow these practices:
- Keep it Simple: Avoid cluttering diagrams with too many details. Stick to the appropriate level of abstraction for the audience. 🧹
- Use Standard Notation: Ensure all team members understand the symbols. Consistency prevents misinterpretation.
- Version Control: Treat DFDs like code. Store them in a repository and track changes over time.
- Regular Reviews: Schedule reviews of the diagrams during sprint planning or phase gates.
- Link to Requirements: Maintain traceability between DFD elements and requirement documents.
Common Challenges and Solutions ⚖️
Integrating DFDs is not always straightforward. Teams often face specific hurdles that can reduce effectiveness.
Challenge 1: Diagrams Become Outdated
As the system evolves, the diagrams are often forgotten.
Solution: Make diagram updates a mandatory part of the Definition of Done for any feature work.
Challenge 2: Ambiguity in Data Flows
Arrows may be unclear about what specific data is being moved.
Solution: Label every flow with the specific data payload (e.g., “User ID” instead of “Data”).
Challenge 3: Over-Engineering
Creating DFDs for every minor detail can slow down development.
Solution: Use DFDs for high-level architecture and major processes. Use simpler sketches for minor UI flows.
Measuring the Impact of DFDs 📈
How do you know if integrating DFDs is working? Look for metrics related to quality and efficiency.
- Requirement Defect Rate: Does the number of defects related to misunderstood requirements decrease?
- Time to Onboard: Do new team members understand the system faster with diagrams?
- Change Request Time: Does the time taken to implement changes reduce when the architecture is documented?
Conclusion 🏁
Data Flow Diagrams are more than just drawings; they are communication tools that define the backbone of a software system. When integrated into the SDLC, they provide a shared understanding of data movement, processing, and storage. This shared understanding reduces errors, improves communication between technical and non-technical stakeholders, and ensures the system remains maintainable over time.
Success depends on discipline. The diagrams must be created, reviewed, and updated as the system evolves. By treating DFDs as living artifacts, teams can navigate the complexity of software development with greater confidence and clarity. The effort invested in these diagrams pays dividends in the form of a robust, well-documented, and reliable system.