Strategic planning is not about guessing the future; it is about understanding the present with clarity. One of the most enduring frameworks for this purpose is the SWOT analysis. This method structures thinking by categorizing factors that are internal and external, positive and negative. It serves as a foundation for decision-making across various sectors, from startups to established corporations.
Building a SWOT analysis is a disciplined process. It requires honesty, data, and a willingness to challenge assumptions. This guide walks you through the entire lifecycle of creating a robust assessment, moving from initial concepts to actionable strategy. We will explore the mechanics of each quadrant, how to gather the necessary intelligence, and how to translate findings into real-world outcomes.
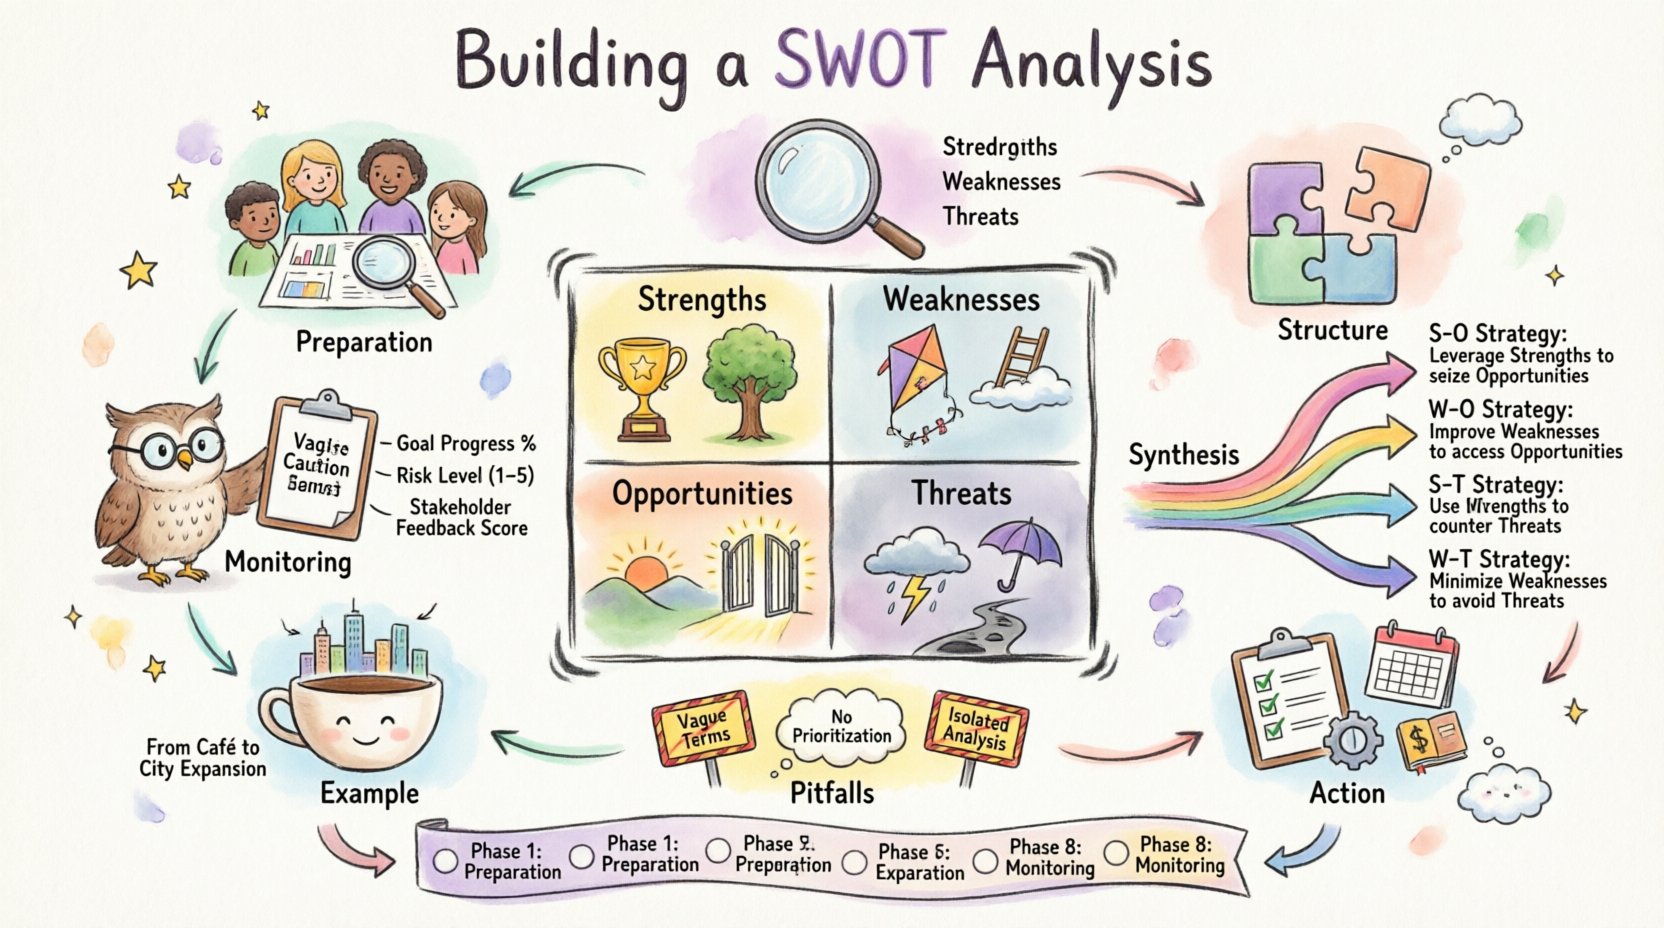
🛠️ Phase 1: Preparation and Scope Definition
Before drawing the four boxes on a whiteboard, you must establish the context. A SWOT analysis without boundaries often becomes a list of random thoughts. To ensure utility, you need to define the scope clearly.
1.1 Defining the Objective
What are you analyzing? Is it the entire organization, a specific department, a new product launch, or a potential market entry? The objective dictates the depth of the research required.
- Organizational Level: Focuses on long-term viability, culture, and overall market position.
- Project Level: Focuses on specific deliverables, timelines, and immediate resource constraints.
- Product Level: Focuses on features, user experience, and competitive pricing.
1.2 Assembling the Team
Analysis is rarely effective when done in isolation. You need diverse perspectives to identify blind spots. Select participants who understand the operational reality.
- Leadership: Provides the strategic vision and resource allocation context.
- Frontline Staff: Understands customer interactions and daily friction points.
- Subject Matter Experts: Offers technical insights regarding technology or compliance.
1.3 Gathering Intelligence
Data drives accurate assessments. Relying on anecdotes can skew results. Collect information from the following sources:
- Financial reports and performance metrics.
- Customer feedback and support tickets.
- Competitor public filings or marketing materials.
- Industry reports and regulatory changes.
- Internal audits and employee surveys.
🧩 Phase 2: The Four Quadrants Explained
The core of the framework divides factors into two dimensions: Internal vs. External, and Controllable vs. Uncontrollable. This structure helps distinguish between what you can change and what you must adapt to.
2.1 Strengths (Internal & Positive)
Strengths are attributes within your control that give you an advantage over others. They are the resources you possess that allow you to perform better than the competition.
- Tangible Assets: Capital reserves, proprietary technology, physical locations, and inventory.
- Intangible Assets: Brand reputation, patents, trade secrets, and corporate culture.
- Capabilities: Specialized skills, efficient processes, and strong leadership teams.
Key Question: What do we do better than anyone else? What unique resources do we possess?
2.2 Weaknesses (Internal & Negative)
Weaknesses are attributes within your control that place you at a disadvantage relative to others. Acknowledging these is often the hardest part, but it is essential for honest planning.
- Resource Gaps: Lack of funding, outdated technology, or insufficient staffing.
- Process Issues: Inefficient workflows, poor communication channels, or slow decision-making.
- Reputational: Negative customer sentiment or lack of market awareness.
Key Question: What do we need to improve? Where are we falling behind the competition?
2.3 Opportunities (External & Positive)
Opportunities are external chances to improve performance. They arise from market trends, technological shifts, or regulatory changes that you can leverage.
- Market Trends: Growing demand for specific services or demographic shifts.
- Technological Advances: New tools that can reduce costs or enhance quality.
- Regulatory Changes: New laws that create a vacuum for new solutions.
- Competitor Moves: A rival exiting the market or facing a scandal.
Key Question: What positive changes in the environment can we exploit?
2.4 Threats (External & Negative)
Threats are external elements that could cause trouble for the business. These are factors outside your control that you must mitigate or prepare for.
- Competition: New entrants with better pricing or features.
- Economic Factors: Inflation, recession, or currency fluctuation.
- Regulatory Risks: Changing compliance requirements or tax increases.
- Supply Chain: Dependency on single vendors or logistical disruptions.
Key Question: What obstacles do we face? What are our competitors doing?
📊 Phase 3: Structuring the Data
Once you have brainstormed the items, they must be organized. A table provides a clear visual representation of the balance between internal and external factors.
| Factor Type | Internal (Controllable) | External (Uncontrollable) |
|---|---|---|
| Positive | Strengths | Opportunities |
| Negative | Weaknesses | Threats |
This grid highlights the dynamic nature of the analysis. Strengths can become weaknesses if not maintained. Opportunities can become threats if competitors act first.
🔗 Phase 4: Synthesis and Strategic Connection
Listing factors is only the first step. The real value lies in connecting them. This process involves looking for intersections where one factor influences another. This is often referred to as strategic alignment.
4.1 S-O Strategies (Maxi-Maxi)
These strategies use internal strengths to maximize external opportunities. This is the ideal scenario for growth.
- Example: If you have a strong brand (Strength) and a new market trend favoring your product (Opportunity), launch an aggressive marketing campaign.
4.2 W-O Strategies (Mini-Maxi)
These strategies overcome internal weaknesses by taking advantage of external opportunities. This requires investment or change.
- Example: If you lack in-house technology (Weakness) but a new software solution is available (Opportunity), invest in that technology to close the gap.
4.3 S-T Strategies (Maxi-Mini)
These strategies use internal strengths to minimize external threats. This is a defensive posture that protects existing value.
- Example: If you have high cash reserves (Strength) and a recession is looming (Threat), use that liquidity to acquire assets at a lower price.
4.4 W-T Strategies (Mini-Mini)
These strategies minimize internal weaknesses and avoid external threats. This is often about survival or risk mitigation.
- Example: If you have poor cash flow (Weakness) and new taxes are incoming (Threat), cut unnecessary costs immediately to remain solvent.
🚀 Phase 5: Turning Analysis into Action
A document that sits on a shelf is useless. The analysis must feed directly into an operational plan. Here is how to move from insight to execution.
5.1 Prioritization
You cannot address every item at once. Use a scoring system to rank the items based on impact and feasibility.
- Impact: How much will this affect the bottom line?
- Feasibility: How easy is it to implement with current resources?
- Urgency: Does this need to be done immediately?
5.2 Assigning Ownership
Every action item needs an owner. Vague responsibilities lead to inaction.
- Assign a specific person or team to each strategy.
- Ensure the owner has the authority to make decisions.
- Set clear deadlines for milestones.
5.3 Resource Allocation
Strategies require funding and personnel. Map your budget to the identified priorities.
- Identify where money needs to be spent.
- Identify where staff needs to be trained.
- Identify where technology needs to be upgraded.
⚠️ Phase 6: Common Pitfalls to Avoid
Even experienced teams make mistakes during this process. Being aware of these traps ensures the analysis remains accurate.
6.1 Confusing Internal and External
A common error is placing external factors in the internal quadrants. For example, “Competitor pricing” is external, not internal. Ensure strict adherence to the definitions of controllability.
6.2 Being Too Vague
Phrases like “Good marketing” or “High quality” are not actionable. Be specific.
- Better: “70% of customers prefer our mobile app over the desktop site due to faster load times.”
6.3 Ignoring the Data
If your analysis suggests a threat, but you ignore it because it is uncomfortable, the process fails. Data must drive the conversation, not ego.
6.4 Static Thinking
The environment changes. A SWOT analysis created today may be obsolete in six months. Schedule regular reviews to update the assessment.
📝 Phase 7: A Practical Example
To illustrate, consider a fictional mid-sized coffee chain looking to expand into a new city.
- Strength: Strong local supplier relationships ensuring fair pricing.
- Weakness: Limited marketing budget compared to national chains.
- Opportunity: A gap in the market for specialty coffee in the target district.
- Threat: Rising commercial rent prices in the area.
Strategy Derived: Leverage the supplier relationships to offer a unique, lower-cost product (Strength) that fills the market gap (Opportunity). Mitigate the rent threat by negotiating longer lease terms upfront (Threat) using the cash flow stability from the existing stores (Strength).
🔄 Phase 8: Monitoring and Maintenance
Once the plan is in motion, you must track progress. Continuous monitoring ensures that the strategy remains aligned with reality.
8.1 Key Performance Indicators (KPIs)
Define metrics that reflect the success of the strategies derived from the SWOT.
- Revenue growth in the new district.
- Customer acquisition costs.
- Employee retention rates.
8.2 Regular Reviews
Schedule quarterly check-ins to review the status of the action items.
- Are the strengths still holding?
- Have new threats emerged?
- Is the budget sufficient?
8.3 Adapting the Framework
If the market shifts drastically, revisit the analysis. The framework is flexible. It can be applied to individual projects, teams, or the whole company at different times.
📈 Final Thoughts on Strategic Clarity
Building a SWOT analysis is an exercise in clarity. It forces you to look at your situation without the filter of optimism or pessimism. By separating what you control from what you do not, you reduce anxiety and increase focus.
The process does not guarantee success, but it significantly reduces the risk of failure by ensuring you are aware of the terrain. It transforms vague ideas into concrete steps. When you follow the steps outlined here, you move from speculation to strategy.
Remember that the goal is not to create a perfect document, but to create a living tool that guides your decisions. Keep it updated, keep it honest, and use it to steer your organization toward its goals.
📎 Checklist for Execution
- ☐ Defined the scope and objective clearly.
- ☐ Assembled a diverse team for the workshop.
- ☐ Gathered all relevant financial and market data.
- ☐ Categorized all points into S, W, O, T quadrants.
- ☐ Validated internal vs. external distinctions.
- ☐ Developed specific strategies for each quadrant intersection.
- ☐ Assigned owners and deadlines to all action items.
- ☐ Set up a schedule for quarterly reviews.