Data integrity serves as the foundation of any robust information system. Without it, decisions made on top of corrupted or lost information lead to operational failures. While many organizations invest heavily in security protocols, the structural understanding of how data moves through a system often remains overlooked. Visual mapping provides a clear, structural view of data movement, allowing architects and analysts to identify vulnerabilities before they manifest as errors.
This article explores the relationship between visual mapping techniques and data integrity. We will examine how mapping data flows helps maintain accuracy, consistency, and reliability across complex environments. By visualizing the journey of information, teams can enforce controls that preserve the trustworthiness of the data.
Understanding Visual Mapping in Data Systems 🧩
Visual mapping, often realized through Data Flow Diagrams (DFDs), is a graphical representation of the flow of data through a system. It does not focus on the physical implementation or the specific technology stack. Instead, it highlights the logical movement of data from entry points to storage and finally to output destinations.
When a team creates a map, they define processes, data stores, external entities, and the data itself. This abstraction is crucial because it separates the logical requirements from the technical constraints. By stripping away the noise of specific software configurations, the map reveals the inherent logic of the data lifecycle.
The primary goal of this mapping is clarity. In complex architectures, data might pass through dozens of intermediate stages. Without a visual guide, tracking the transformation of a single data point becomes nearly impossible. Visual mapping consolidates these paths into a coherent structure, making it easier to audit and verify.
The Intersection of Mapping and Integrity 🔒
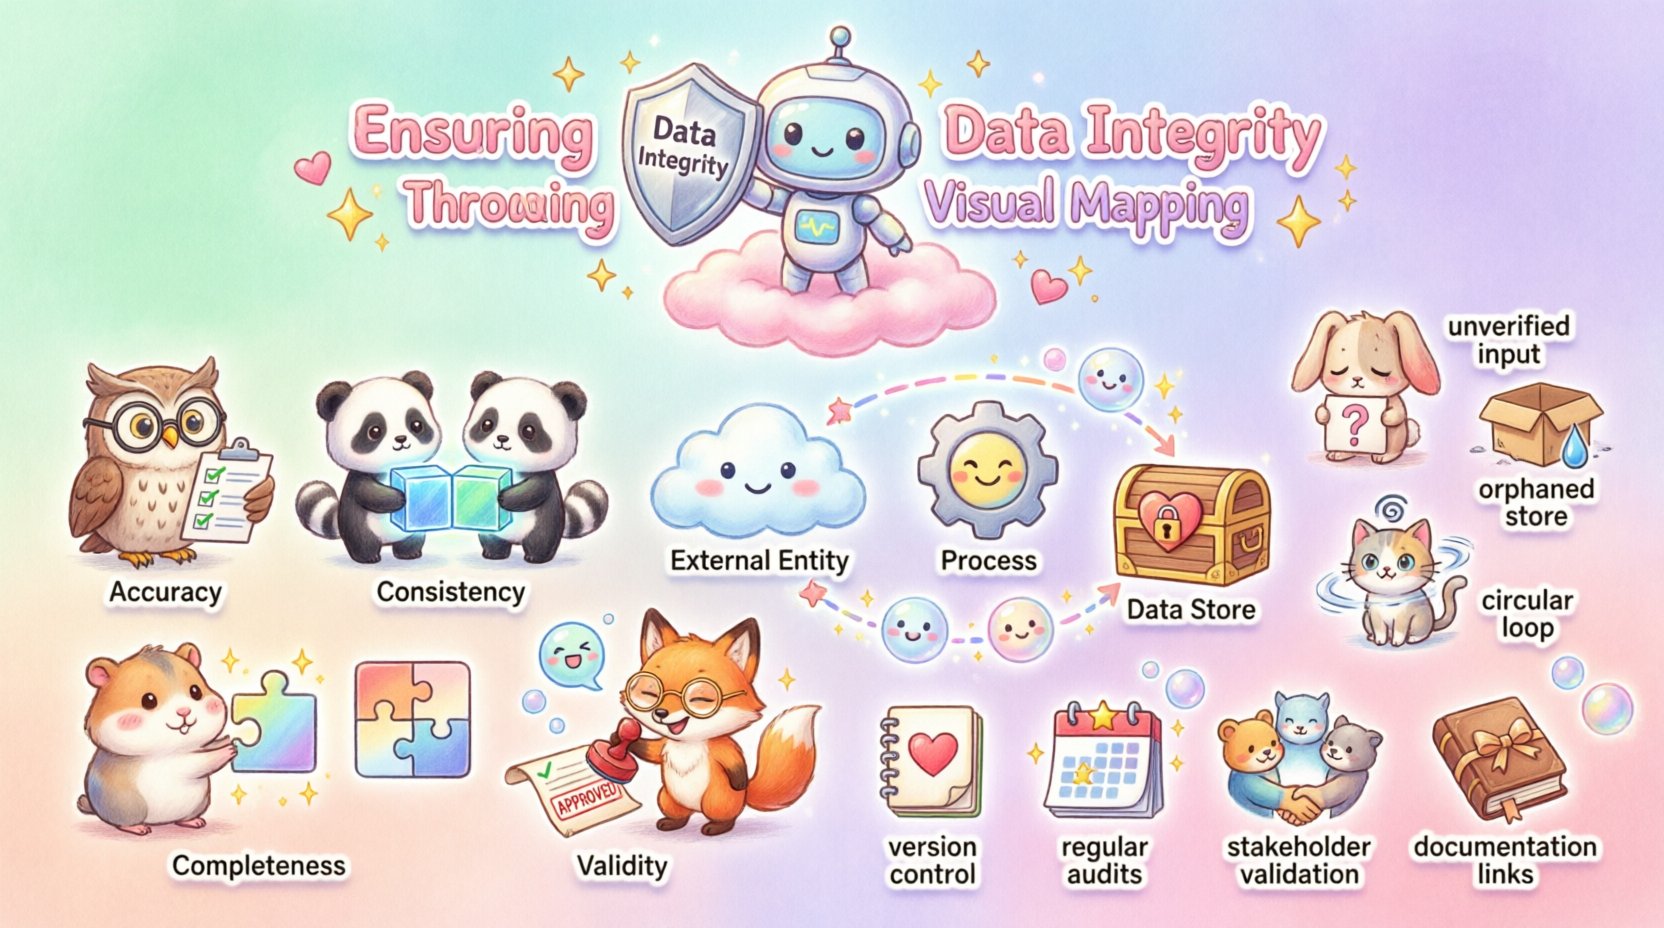
Data integrity is not a single attribute but a collection of properties that data must maintain throughout its existence. These properties include accuracy, completeness, consistency, and validity. Visual mapping supports each of these attributes by forcing the analyst to define exactly what data enters the system, how it changes, and where it resides.
Consider the process of data entry. If a field is required but the visual map does not show a validation checkpoint, the data might enter the system in an incomplete state. By drawing the flow, the analyst is compelled to ask: “Where is the validation happening?” and “What happens if the data is malformed?”
Key Integrity Attributes Supported by Mapping
- Accuracy: Ensures data reflects the real-world entity it represents. Maps show transformation rules that might alter values.
- Consistency: Ensures data is uniform across different parts of the system. Maps reveal where data is replicated or synchronized.
- Completeness: Ensures all necessary data is present. Maps highlight required inputs and mandatory storage locations.
- Validity: Ensures data conforms to defined rules and formats. Maps identify checkpoints where format checks occur.
When these attributes are mapped visually, gaps in logic become obvious. A missing arrow leading to a storage node suggests data might be lost. A process without an input suggests a lack of control. These visual gaps often correspond directly to integrity risks.
Core Components of a Data Flow Diagram 📊
To effectively use visual mapping for integrity assurance, one must understand the building blocks. Every diagram relies on a standard set of elements to communicate the flow accurately.
| Component |
Description |
Integrity Relevance |
| External Entity |
Source or destination of data outside the system. |
Defines trusted boundaries and input validation needs. |
| Process |
A transformation or action performed on data. |
Where data is modified, checked, or aggregated. |
| Data Store |
Where data is held for future use. |
Defines persistence and backup requirements. |
| Data Flow |
The movement of data between components. |
Shows where data travels and potential exposure points. |
Each component requires specific attention when maintaining integrity. For example, a Data Store represents a point of rest. If the map shows multiple processes writing to the same store simultaneously, race conditions may occur. These are integrity risks that the visual map exposes.
Step-by-Step Implementation of Visual Mapping 🛠️
Creating a map that effectively safeguards integrity requires a structured approach. It is not enough to simply draw lines between boxes. The following steps outline a rigorous process for developing these diagrams.
1. Define the System Boundary
Start by determining what is inside the system and what is outside. External entities interact with the system, but the system itself is responsible for the internal logic. Clearly marking the boundary helps identify where data validation must occur before it enters the protected zone.
2. Identify Major Processes
List the high-level functions that transform data. Avoid technical details here. Focus on the business logic. For instance, instead of “SQL Insert Statement,” use “Save Record.” This keeps the map readable and focused on the data journey.
3. Trace Data Flows
Draw arrows to show how data moves between processes, stores, and entities. Every arrow must be labeled with the specific data it carries. If a flow contains multiple pieces of data, split them. This granularity helps in tracking specific fields for integrity checks.
4. Specify Data Stores
Mark where data rests. Are these temporary caches or permanent archives? The type of store affects how integrity is maintained. Permanent stores require stricter access controls and logging mechanisms.
5. Review for Balance
Ensure that every input to a process has a corresponding output. If data enters a process and disappears without being stored or passed on, it is lost. This principle of balance is critical for ensuring no data is dropped during transformation.
Identifying Anomalies and Risks 🔍
Once the map is complete, it serves as a tool for analysis. Analysts can review the diagram to find inconsistencies or potential failures. This section details specific anomalies to look for during the review process.
1. Unverified Inputs
Look for flows originating from external entities that lead directly to internal processes without a validation step. If data enters the system without a check, the integrity of downstream results is compromised.
2. Orphaned Data Stores
Check for data stores that receive data but do not pass it to any other process. These are often forgotten archives. While they might be valid, they can become security risks if not managed. They also represent data that might be inaccessible for future reporting.
3. Circular Dependencies
Identify loops where Process A feeds Process B, which feeds back to Process A. While sometimes necessary for iterative calculations, these can lead to infinite loops or data corruption if not properly controlled.
4. Missing Transformation Rules
If data flows between processes without a clear label on how it changes, the integrity is ambiguous. For example, a date field might change format. If the map does not specify this, downstream systems might interpret the date incorrectly.
Best Practices for Maintenance 📝
A visual map is not a one-time artifact. As systems evolve, the map must evolve with them. Stale maps provide false confidence. Here are practices to keep the mapping accurate and useful.
- Version Control: Treat the diagrams like code. Store them in a repository to track changes over time.
- Regular Audits: Schedule periodic reviews to ensure the diagram matches the current system behavior.
- Stakeholder Validation: Have business users verify that the map reflects their understanding of the processes.
- Documentation Links: Link the diagram to detailed specifications. The map is a summary, not a replacement for detailed logic.
Maintaining these maps requires discipline. It is often tempting to update the code and forget the diagram. However, the diagram is the blueprint for integrity. Without it, changes become blind risks.
The Role of Automation in Mapping 🤖
While manual creation is valuable, automation can assist in maintaining integrity. Some systems can generate flow diagrams based on code analysis. This reduces the gap between the written code and the visual representation.
Automated tools can also monitor data flows in real-time. If a flow deviates from the mapped path, alerts can be triggered. This dynamic approach adds a layer of protection beyond the static diagram.
However, automation should not replace human review. Automated maps can miss business logic nuances that are not visible in the code structure. Human analysts must interpret the data semantics to ensure the map truly reflects the integrity requirements.
Integrating Mapping with Quality Assurance 🧪
Visual mapping integrates well with testing strategies. Test cases can be derived directly from the data flows. Every arrow represents a potential test scenario. Every process represents a function that needs verification.
When a test fails, the map helps locate the source. If data arrives at a destination in the wrong format, the map shows which transformation process was responsible. This accelerates debugging and ensures that fixes are applied to the correct logic.
Final Considerations for Data Architects 🏗️
Adopting visual mapping for integrity assurance is a strategic decision. It requires an investment in time and discipline. The benefits, however, are substantial. Systems built with mapped integrity are easier to debug, secure, and scale.
It is essential to remember that integrity is a continuous state. It is not achieved once and forgotten. The map is the tool that keeps the system honest. It provides the context for every decision made about data storage, movement, and protection.
By following these principles, organizations can build systems where data remains trustworthy. This trust is the currency of modern information systems. Without it, efficiency collapses. With it, operations flow smoothly and reliably.
Summary 📌
Visual mapping through Data Flow Diagrams offers a powerful method for ensuring data integrity. It moves beyond abstract concepts to provide a concrete view of how information travels. By identifying components, tracing flows, and reviewing for anomalies, teams can prevent errors before they occur.
The process requires discipline and regular maintenance. It is not a passive activity but an active part of system design. When combined with quality assurance and automation, it forms a robust framework for data governance. This approach ensures that data remains accurate, consistent, and reliable throughout its lifecycle.
For any organization handling sensitive or critical information, visual mapping is not optional. It is a necessary practice to safeguard the value of data. Start by mapping your core processes. Identify the flows. Secure the integrity. The result is a system built on a foundation of trust.