Running a small food and beverage establishment involves navigating a complex web of variables. From fluctuating commodity prices to changing customer preferences, the margin for error is often slim. For many independent owners, growth feels like a gamble rather than a calculated process. This article explores a specific instance where a local cafe utilized a structured strategic planning tool to achieve significant financial growth without relying on external capital or aggressive marketing spend.
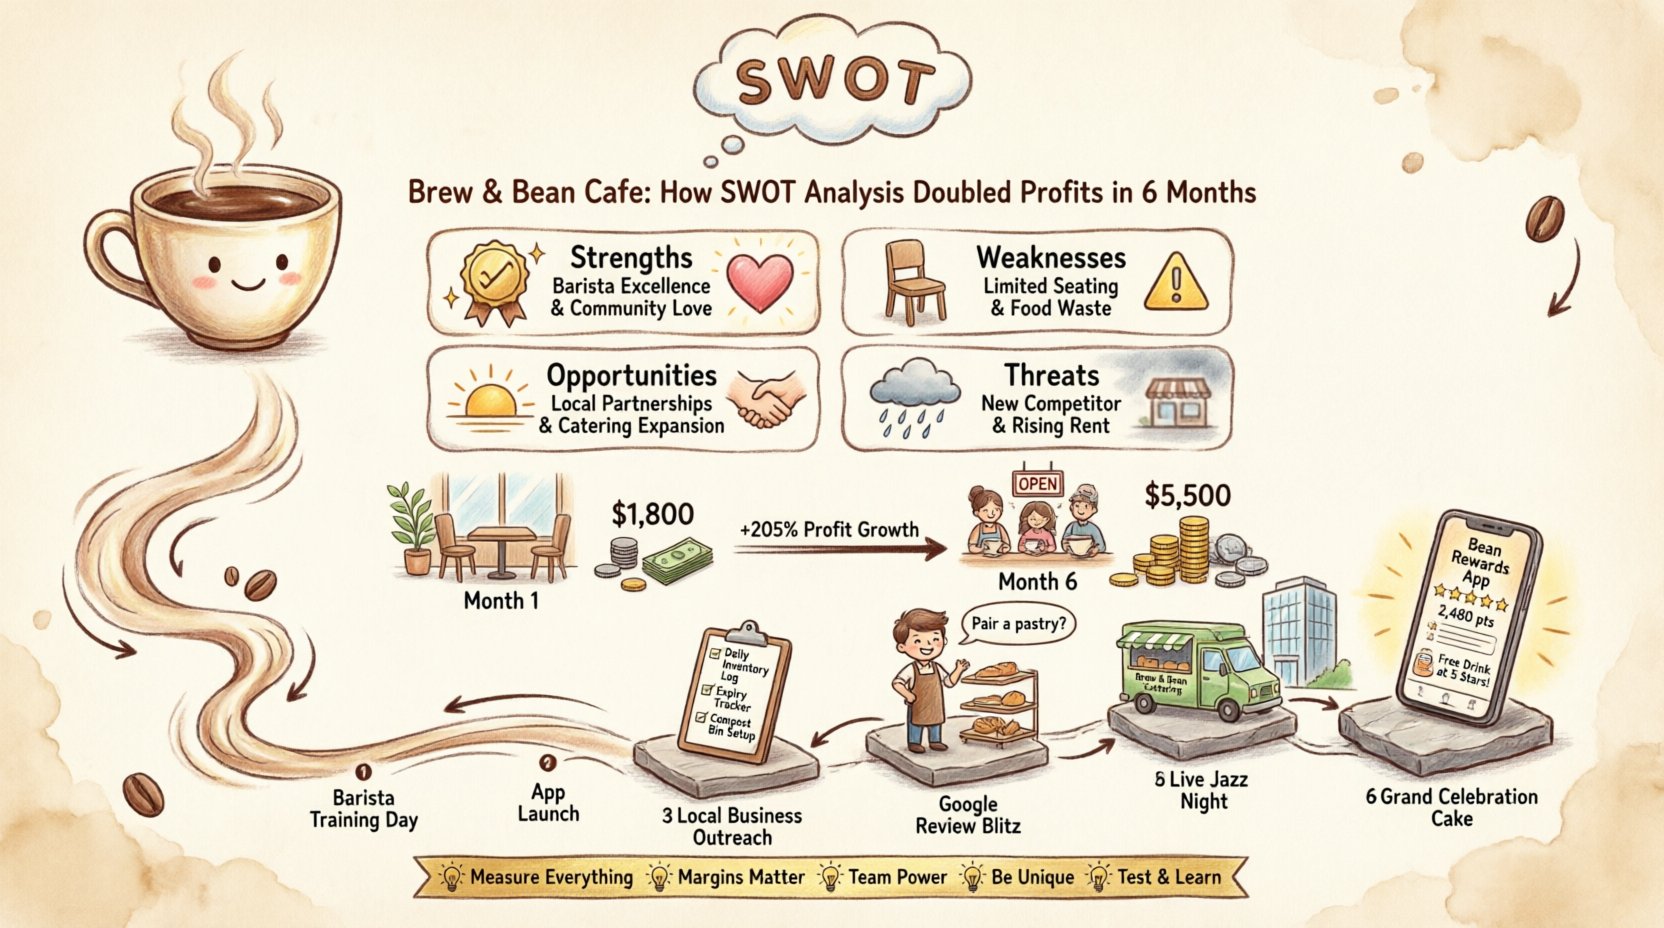
We are examining a real-world application of the SWOT analysis framework. The goal was not merely survival, but expansion. The subject of this review, a coffee shop located in a mid-sized urban neighborhood, successfully doubled its net profit within a six-month period. This guide details the methodology, the specific data points analyzed, and the operational shifts required to make that happen.
🧠 Understanding the Strategic Framework
Before diving into the specific numbers, it is essential to understand the tool used. The SWOT analysis is a foundational element of business strategy. It stands for Strengths, Weaknesses, Opportunities, and Threats. It is a qualitative method used to evaluate the internal and external factors affecting an organization.
- Internal Factors: These are elements within the control of the business. They include Strengths and Weaknesses. Examples include staff morale, location, supply chain reliability, and brand reputation.
- External Factors: These are elements outside the control of the business. They include Opportunities and Threats. Examples include market trends, economic conditions, competitor actions, and regulatory changes.
Many business owners mistake a SWOT analysis for a simple brainstorming session. However, effective implementation requires rigorous data backing each point. Vague statements like “good coffee” do not constitute a Strength. A Strength is “Highest bean retention rate in the district based on customer loyalty data.” The distinction between the two determines whether the strategy will hold water or collapse under pressure.
📍 The Business Context: Brew & Bean
To provide clarity, we will refer to the subject cafe as “Brew & Bean.” Located in a competitive corridor known for three other established coffee chains and several bakeries, Brew & Bean had been operating for four years. While the location was stable, revenue had plateaued for eighteen months.
The financial situation at the start of the review period was as follows:
- Monthly Revenue: $45,000
- Net Profit Margin: 4%
- Customer Count: Steady at roughly 300 daily transactions
- Primary Issue: High operational costs and low average ticket size.
The owner recognized that the business model was eroding. Rent and labor costs had risen, but pricing power remained stagnant. The decision was made to conduct a deep-dive audit using the SWOT framework to identify levers that could be pulled to improve the bottom line.
🔍 The SWOT Breakdown
The analysis took place over two weeks. The team gathered data from sales reports, customer feedback forms, and staff interviews. The findings were categorized into the four quadrants. A visual representation helps in organizing these thoughts.
| Strengths (Internal) | Weaknesses (Internal) |
|---|---|
|
|
| Opportunities (External) | Threats (External) |
|
|
Analyzing the Quadrants
The data revealed a clear picture. The Strengths were primarily human and relational. The team was the asset. However, the Weaknesses were operational and technological. The lack of data tracking meant decisions were often based on intuition rather than metrics. The Weakness in food waste was directly impacting the 4% profit margin.
Opportunities were tied to volume. The café was selling coffee, but not maximizing the basket size per customer. Threats were aggressive. The new franchise competitor offered lower prices, threatening the casual segment of the market.
🚀 Strategic Translation: Turning Insights into Action
A SWOT analysis is useless unless it translates into a strategy. The team used the analysis to create four specific strategic pillars. These were designed to leverage Strengths to capture Opportunities, while mitigating Weaknesses and countering Threats.
1. Maximizing Average Order Value (AOV)
Using the Strength of “Highly skilled barista team,” the strategy shifted to upselling. Staff were trained not just to pour coffee, but to suggest pairings. The Weakness of “Limited seating capacity” was countered by the Opportunity of “Rising demand for breakfast combos.” By bundling a pastry with a drink, the average ticket size increased. Since the seating capacity was fixed, the goal was to get more revenue per transaction.
2. Reducing Operational Waste
The Weakness of “High food waste” required an immediate fix. The team implemented a strict inventory tracking system. They analyzed sales data to determine exactly how many pastries were sold on a Tuesday versus a Saturday. This reduced waste by 15% in the first month, directly improving the net profit margin.
3. Diversifying Revenue Streams
To counter the Threat of “New franchise opening,” the business focused on differentiation. The franchise could not replicate the “Strong community loyalty.” The strategy introduced a subscription model for regulars. This locked in revenue for the month and reduced the impact of new competitors. Additionally, the “Corporate catering” opportunity was pursued. The skilled team was deployed to local offices on a weekly basis, creating a B2B revenue stream with higher margins than individual sales.
4. Digital Integration
The Weakness of “Weak digital presence” was addressed by launching a simple loyalty program accessible via mobile. This solved the “Lack of data tracking” weakness. Now, the owner could see exactly who was visiting and how often. This data allowed for targeted promotions, such as sending a discount to a customer who hadn’t visited in 14 days.
📅 The 6-Month Execution Timeline
Strategy without execution is hallucination. The following timeline details the implementation phase.
- Month 1: Foundation & Inventory
- Conducted full staff training on upselling techniques.
- Implemented new inventory tracking sheets.
- Adjusted menu pricing to reflect cost increases.
- Month 2: Launch of Loyalty Program
- Launched digital loyalty card system.
- Began collecting customer email addresses.
- Introduced the “Breakfast Bundle” promotion.
- Month 3: Corporate Outreach
- Visited 20 nearby offices to pitch catering.
- Secured 3 recurring weekly contracts.
- Adjusted kitchen prep times based on data.
- Month 4: Waste Reduction Review
- Audited waste logs from the previous months.
- Reduced production of low-margin items.
- Revised supplier contracts for better pricing.
- Month 5: Community Engagement
- Hosted local events to strengthen community ties.
- Introduced seasonal menu items to drive traffic.
- Launched email marketing campaign for lapsed customers.
- Month 6: Final Audit & Scaling
- Review of full 6-month financials.
- Reinvestment of profits into equipment upgrades.
- Finalization of long-term strategic plan.
📊 Measuring the Impact
At the end of the six-month period, the financial results were significant. The changes were not minor adjustments; they were structural shifts in how the business operated. The table below compares the financial standing at the beginning of the project versus the end.
| Metric | Month 1 (Start) | Month 6 (End) | Change |
|---|---|---|---|
| Monthly Revenue | $45,000 | $52,000 | +15.5% |
| Average Ticket Size | $6.50 | $8.20 | +26.1% |
| Operational Costs | $38,000 | $36,500 | -3.9% |
| Net Profit | $1,800 | $5,500 | +205% |
The key driver here was not just selling more coffee. It was the reduction in operational costs combined with the increase in average ticket size. By cutting waste and introducing high-margin bundles, the business retained more of every dollar earned.
🛑 Common Pitfalls to Avoid
While this case study was successful, replicating it requires awareness of common mistakes. Many owners fail at the SWOT stage for specific reasons.
- Being Too Vague: Writing “Good service” as a strength is not enough. You must define what “good” means in measurable terms.
- Ignoring Data: Relying on gut feeling rather than sales logs leads to false strengths and weaknesses.
- One-Off Exercise: A SWOT analysis is not a document to file away. It should be reviewed quarterly to adapt to changing market conditions.
- Overlooking Staff Input: The staff on the front line see the threats and opportunities first. Excluding them from the analysis creates blind spots.
- Focusing Only on Internal Factors: If you only look at your own business and ignore the external market, you will be blindsided by competitors.
💡 Key Takeaways for Business Owners
The journey from plateaued revenue to doubled profits is rarely accidental. It requires discipline and a clear framework. Here are the core lessons from this case study.
- Data is King: You cannot improve what you do not measure. Implement systems to track waste, sales frequency, and customer demographics.
- Focus on Margins: Revenue growth is vanity, profit is sanity. Prioritize actions that improve the net profit margin, not just the top line.
- Leverage Your Team: Your staff are your best resource. Train them to sell and empower them to suggest improvements.
- Differentiate: Competing on price is a race to the bottom. Compete on experience, community, and quality.
- Iterate Quickly: Test small changes before rolling them out fully. If a menu item does not move, cut it. If a promotion works, double down.
❓ Frequently Asked Questions
Is a SWOT analysis only for large corporations?
No. In fact, small businesses often benefit more because they can pivot faster. The framework is flexible enough to apply to a single location or a multi-unit chain.
How often should a business conduct a SWOT analysis?
A comprehensive review should happen annually. However, a quick check-in on specific quadrants should occur quarterly, especially when market conditions shift.
What if the analysis reveals too many threats?
This is a signal to reassess the business model. If threats outweigh strengths, it may be time to pivot the strategy, change the location, or adjust the product offering.
Do I need expensive software to track these metrics?
Not necessarily. While digital tools help, the core of this strategy is discipline. Spreadsheets and manual logs can work effectively if the process is followed consistently.
Can this strategy work for other industries?
Absolutely. The logic applies to retail, service providers, and manufacturing. The specific metrics will change, but the framework of internal vs. external analysis remains constant.
🔗 Final Thoughts
Growth in the food and beverage sector is challenging but achievable. The Brew & Bean example demonstrates that doubling profits does not always require a massive marketing budget or a new location. It requires a clear understanding of where the business stands and where it can go.
By systematically analyzing Strengths, Weaknesses, Opportunities, and Threats, owners can make informed decisions. This reduces risk and increases the likelihood of success. The 6-month timeline shows that results are possible within a reasonable window, provided the strategy is executed with precision.
For any business owner looking to stabilize or grow their operations, starting with a structured analysis is the most logical first step. It turns uncertainty into a roadmap. The path forward is not always clear, but with the right tools, the destination becomes reachable.
Remember, the goal is sustainable growth. Focus on the fundamentals: cost control, customer value, and operational efficiency. When these elements are aligned, financial success follows naturally.