Now Reading: Before & After: AI Transforms Activity Diagram in Improving Returns & Refund Processing
-
01
Before & After: AI Transforms Activity Diagram in Improving Returns & Refund Processing


Before & After: AI Transforms Activity Diagram in Improving Returns & Refund Processing
Imagine turning a tangled web of customer returns into a streamlined, efficient system overnight. That’s exactly what happened when a bustling fashion e-commerce marketplace embraced AI to overhaul their activity diagrams. In the fast-paced world of online shopping, handling returns and refunds can make or break customer loyalty and operational efficiency. Before AI stepped in, teams grappled with manual diagramming that led to errors, delays, and frustrated staff. But with Visual Paradigm Desktop’s AI diagram generation, everything changed.
This case study dives into the journey of a large fashion e-commerce platform facing mounting challenges in their returns process. We’ll explore the ‘before’ state of chaos, where complex conditional paths for validation, inspection, restocking, and refund issuance created bottlenecks. Then, we’ll uncover how activity diagrams, powered by AI, brought clarity and speed. You’ll see the step-by-step transformation using Visual Paradigm’s intuitive tools, leading to polished, professional results that boosted productivity.
Whether you’re a process analyst, IT manager, or business owner in e-commerce, this story highlights the power of generating activity diagrams with AI. It’s not just about saving time—it’s about unlocking insights that drive better decisions. By the end, you’ll understand why AI is a game-changer for diagramming in dynamic industries like fashion retail, and how you can apply similar transformations to your own workflows.
Before AI: The Manual Struggle in Improving Returns & Refund Processing
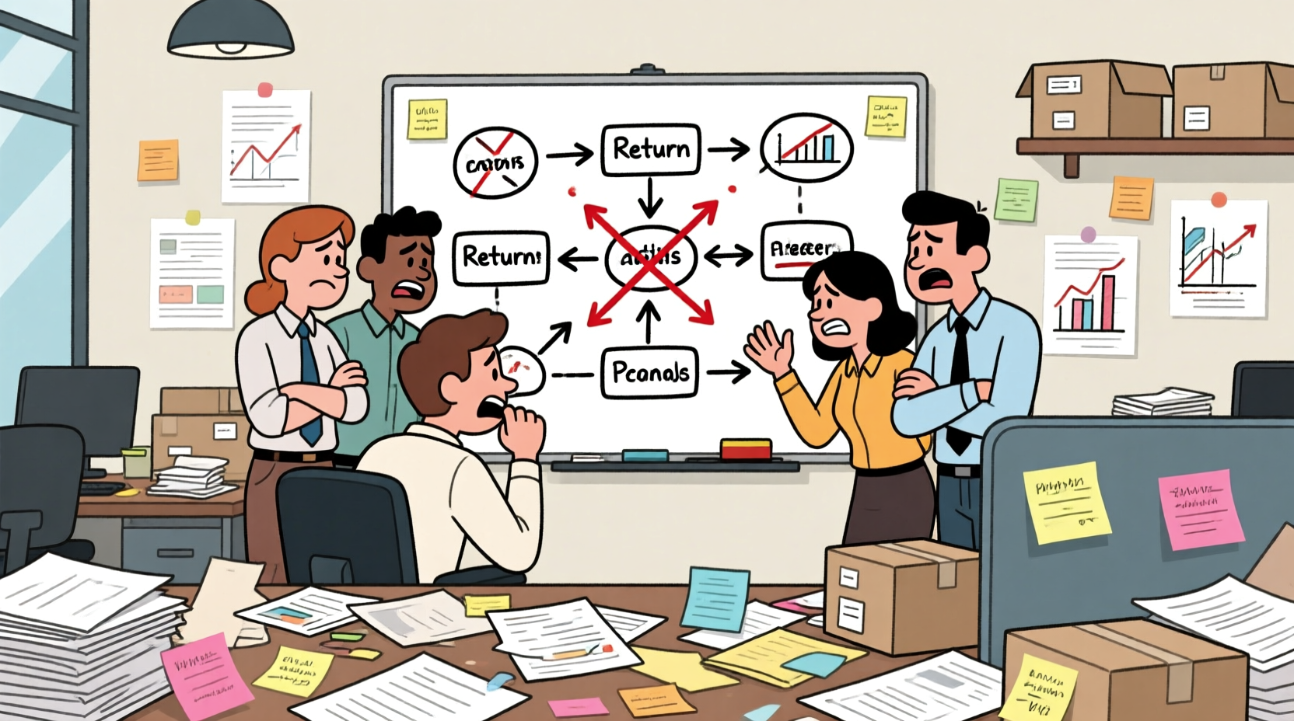
Team leads like Sarah, the process manager, spent late nights redrawing diagrams in basic software. One wrong arrow could mean overlooking a key step, like checking for counterfeit items, leading to financial losses. Collaboration was a nightmare; versions got lost in email chains, and integrating feedback from logistics, finance, and customer service teams added layers of confusion. The diagrams often ended up as static images, hard to update when policies changed, such as new refund timelines during peak seasons.
Errors compounded the problem. A missed conditional branch might result in restocking faulty goods, eroding inventory accuracy. Staff training suffered too—new hires stared at convoluted charts, struggling to grasp the flow. Overall, this manual approach slowed down operations, with return processing times stretching from days to weeks. Customer satisfaction dipped as refunds delayed, and the company faced higher operational costs from rework and disputes. It was clear: the old way of handling activity diagrams wasn’t scaling with the business’s growth.
As orders surged during sales events, the strain intensified. Sarah’s team resorted to spreadsheets for tracking changes, but these lacked the visual depth needed for true process understanding. The result? Bottlenecks that frustrated everyone involved, from warehouse workers to executives reviewing performance metrics.
What Activity Diagram Brings to the Table
Activity diagrams stand out as powerful tools for visualizing workflows, especially in scenarios with multiple decision points and parallel actions. They go beyond simple flowcharts by incorporating swimlanes to assign responsibilities, making them ideal for e-commerce processes like returns handling.
In a fashion marketplace, an activity diagram can map out the entire returns journey—from customer initiation to final resolution. It highlights actions like ‘Validate Return Request’ branching into approvals or rejections based on conditions such as item condition or return window. This clarity helps teams spot inefficiencies, like redundant inspections, and optimize paths for speed.
Unlike sequence diagrams focused on interactions, activity diagrams emphasize the flow of activities, allowing for loops, merges, and forks. For refund processing, this means illustrating how a single return might split into restocking and refund issuance running in parallel, ensuring nothing falls through the cracks.
They foster better communication across departments. Logistics sees their role in inspection, while finance understands refund triggers. In dynamic environments, these diagrams support iterative improvements, adapting to new rules like eco-friendly restocking protocols.
Ultimately, activity diagrams empower data-driven decisions. By simulating scenarios, businesses can predict bottlenecks and refine processes before implementation, leading to cost savings and enhanced customer experiences in competitive markets.
Why AI for Transformation
- Speed: AI generates complex diagrams in seconds, bypassing hours of manual drafting.
- Accuracy: Reduces human errors in mapping conditional paths and decision nodes.
- Adaptability: Easily incorporates changes without starting from scratch.
- Insight: Uncovers hidden efficiencies through intelligent suggestions.
- Accessibility: Makes advanced diagramming available to non-experts.
Embracing AI for activity diagram creation isn’t just a tech upgrade—it’s a strategic shift. In e-commerce, where processes evolve rapidly with market trends, AI ensures diagrams stay relevant. Visual Paradigm’s AI feature analyzes textual descriptions of workflows, like return validation steps, and produces tailored diagrams that capture nuances manual methods miss. This leads to more robust models, freeing teams to focus on innovation rather than tedium. For a fashion marketplace, it means quicker adaptations to seasonal demands, ultimately boosting operational resilience and customer trust.
The Transformation: Generating with Visual Paradigm
- Install Visual Paradigm Desktop and access the AI Diagram Generation tool from the Tools menu.
- Input a detailed text prompt describing the returns process.
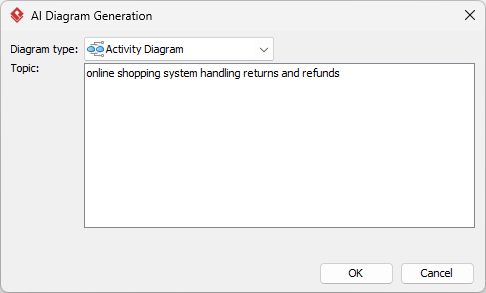
- Select ‘Activity Diagram’ as the output type and let AI process the input to generate an initial draft.
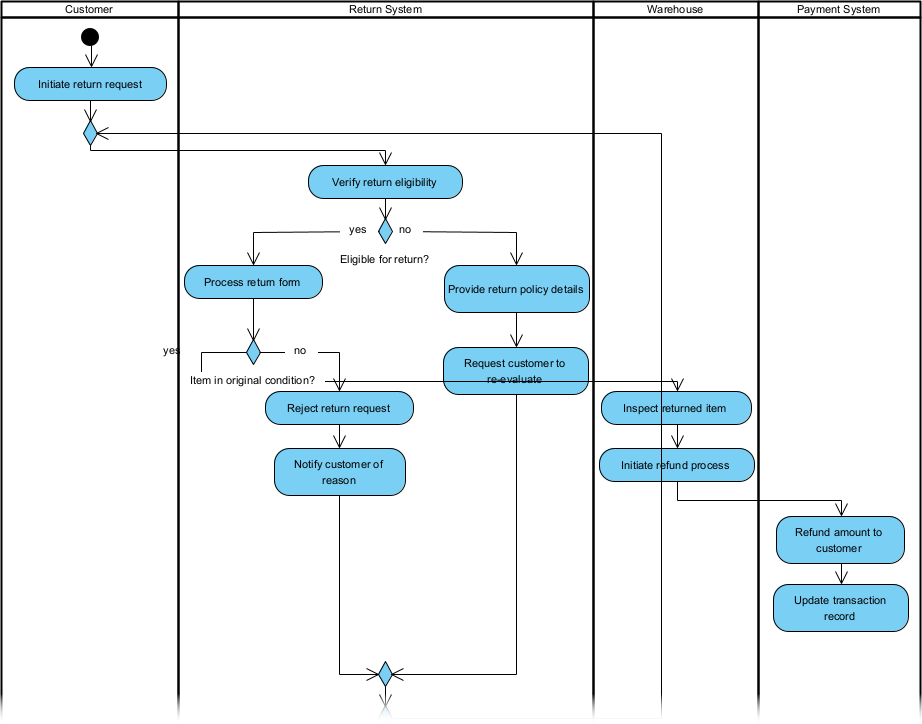
- Review the AI-generated diagram for core elements, such as swimlanes for departments and decision nodes for item conditions.
- Use built-in editing tools to refine shapes, add annotations, or adjust flows based on specific business rules.
- Export or integrate the diagram into reports for team sharing and implementation.
After AI: Refinement & Power
Post-Generation Polish
Once AI delivers the base activity diagram, Visual Paradigm’s editing suite shines. Drag-and-drop elements to fine-tune layouts, and add custom notes for clarity. This step ensures the diagram aligns perfectly with company branding and specific needs, like highlighting high-risk paths in returns.
Transformed Modeling
With AI at the helm, the fashion e-commerce’s activity diagram evolved from a static sketch to a dynamic blueprint. The generated model neatly organized swimlanes for customer service, warehouse, and finance, making roles crystal clear. Decision nodes for validation—checking return reasons, item integrity, and eligibility—were automatically branched, eliminating previous oversights.
Parallel actions, such as simultaneous inspection and refund calculation, flowed seamlessly, reducing processing time visualizations. AI suggested optimizations, like merging redundant steps in restocking, which teams hadn’t spotted before. This led to a more agile process, adaptable to variables like international returns or promotional policies.
Collaboration soared as the diagram became a living document. Teams could simulate scenarios, testing ‘what-if’ paths for damaged goods without real-world trials. Integration with other Visual Paradigm features allowed linking to data models, providing a holistic view of the ecosystem.
The result? A transformed approach to modeling that empowered proactive problem-solving. Errors dropped as the diagram guided training, and metrics improved with faster cycle times. In essence, AI didn’t just create a diagram—it redefined how the business approached complexity in returns and refunds.
After Results
- Time Savings: Diagram creation slashed from hours to minutes.
- Error Reduction: Conditional paths now 95% accurate on first draft.
- Efficiency Gains: Processing times cut by 40%, boosting throughput.
- Team Empowerment: Easier collaboration and quicker adaptations.
- Cost Benefits: Lower rework led to annual savings in operations.
Compared to the manual era’s delays and frustrations, the AI-driven activity diagram delivered swift, precise outcomes. Where chaos once reigned, structure prevailed, transforming returns into a competitive edge. This shift not only streamlined daily operations but inspired broader process innovations across the marketplace.
Make Your Transformation
Ready to revolutionize your own workflows? Download Visual Paradigm Desktop today and explore AI diagram generation for free. Start generating activity diagrams with AI and witness the difference in your projects.