Now Reading: Streamlining Visual Communication: A Guide to Visual Paradigm’s AI Infographic Generator
-
01
Streamlining Visual Communication: A Guide to Visual Paradigm’s AI Infographic Generator


Streamlining Visual Communication: A Guide to Visual Paradigm’s AI Infographic Generator
If you have ever tried to create a professional infographic, you are likely familiar with the struggle of choosing between a blank canvas and a rigid template. Traditional design workflows often force creators to choose between total creative freedom, which requires immense time and skill, or strict constraints that limit expression. Visual Paradigm’s AI Infographic Generator completely changes this dynamic by shifting the focus from manual “pixel-pushing” to high-level idea generation.
This comprehensive guide explores how to navigate this tool, framed by the specific ways it solves the headaches of traditional design.
The Traditional Bottleneck: Why Old Methods Fail
Before diving into the AI workflow, it is helpful to understand the common “traps” of traditional infographic creation. These barriers often discourage professionals from visualizing data effectively.
The “Blank Page” Syndrome
Starting from scratch in professional vector tools like Adobe Illustrator or even PowerPoint requires you to manually plan every aspect of the design. You are responsible for the layout, color scheme, typography, and hierarchy. This process is extremely time-consuming and requires high-level design skills to execute a polished look.

The Rigidity of Static Templates
While tools like Canva offer aesthetic templates, they are often locked into a predefined number of elements. This creates a significant logical disconnect between the data and the design.
The Layout “Break”
Perhaps the most frustrating issue in traditional design is the scalability problem. If you have a five-step process but your chosen template only features four boxes, you run into a major hurdle. Manually adding that fifth item usually breaks the layout. It leads to uneven spacing, overlapping sections, or distorted proportions as you try to “cram” information in. This typically necessitates a complete redesign or a compromise on content.
Laying the Foundation: Choosing Your AI Template
The AI journey within Visual Paradigm starts in a template gallery. Unlike traditional static templates, these serve as a flexible foundation rather than a rigid cage.
Pro-Tip: Match the template to your data’s logic. If you are showing a sequence, such as “Steps in the Solar Energy Process,” choose a timeline or progression-style layout. This ensures the visual structure matches the nature of your information from the very start, providing a cohesive narrative flow.
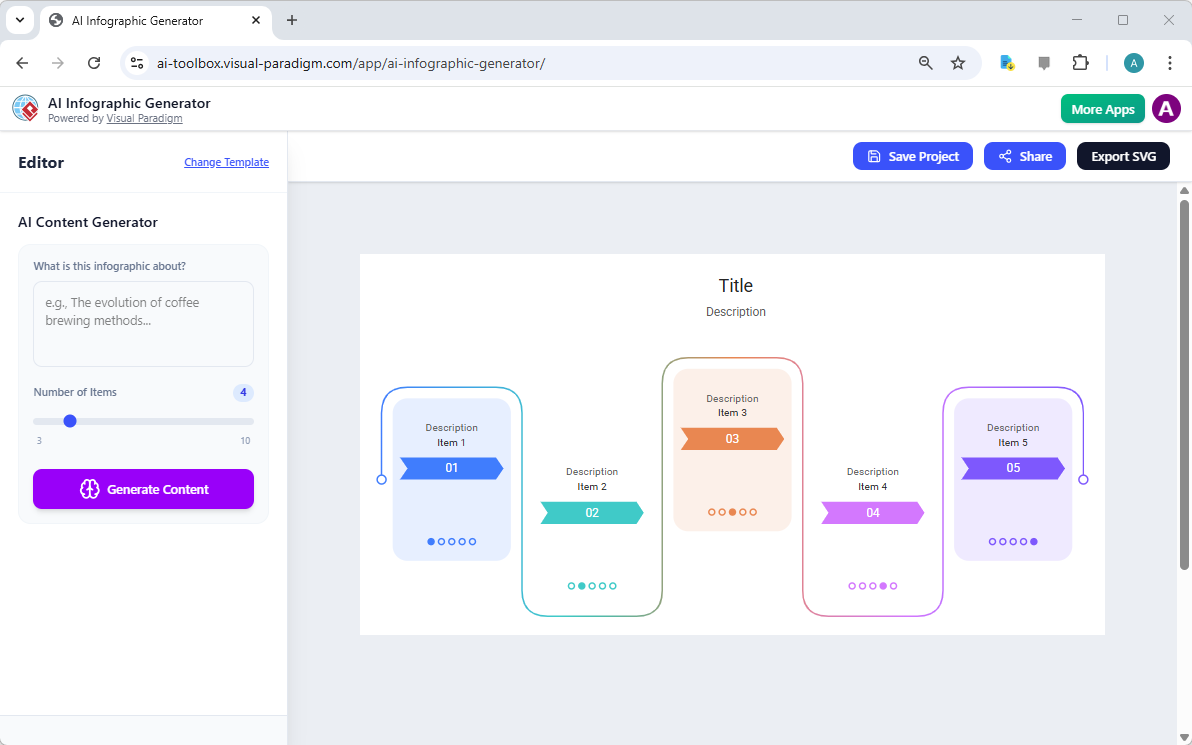
Prompting and the “Magic” Slider
Once in the editor, you use the input pane to guide the AI. This is where the tool differentiates itself from standard graphic editors.
- The Prompt: Enter a clear topic (e.g., “Steps in the Solar Energy Process”). The AI uses this input to research and structure the content for you, effectively acting as a copywriter and researcher.
- Dynamic Item Handling: This is the specific technical solution to the “rigidity” problem mentioned earlier. Instead of manually resizing boxes and grouping elements, you use the “Number of Items” slider. If your process requires six stages, simply set the slider to six. The AI automatically adjusts the layout to fit perfectly, ensuring there are no overlapping elements or awkward gaps.
Letting AI Do the “Heavy Lifting”
When you click “Generate Content,” the tool eliminates the need for manual research and data organization. In seconds, it generates a fully-rendered visual story. This capability transforms the workflow from hours of manual labor to a few moments of processing.
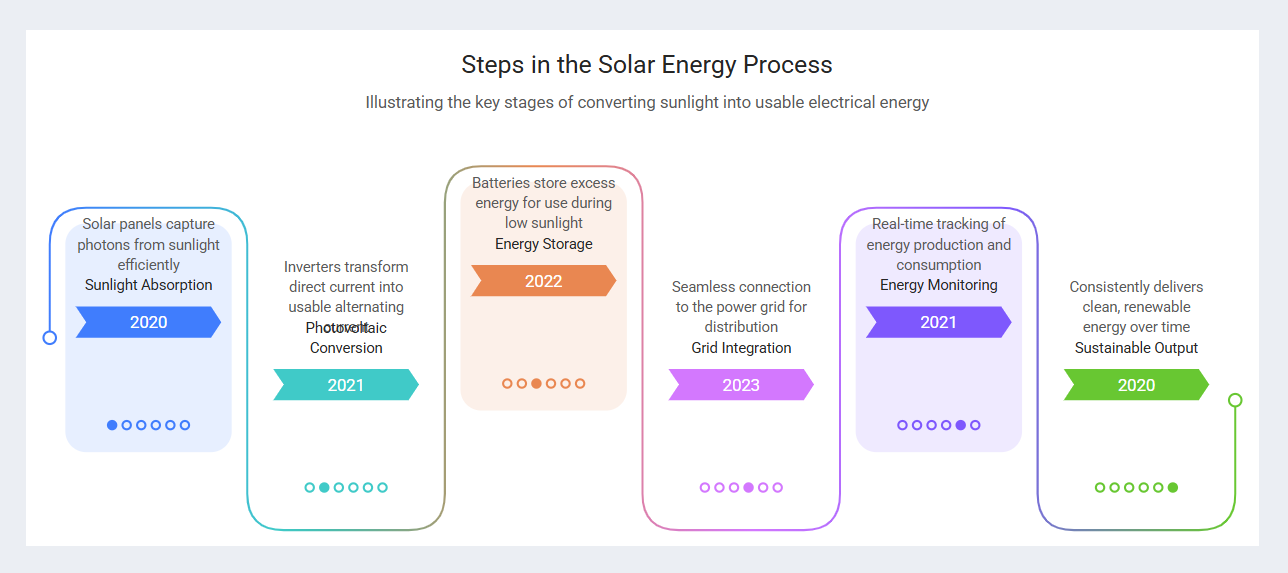
Example Case Study: Solar Energy Timeline
To illustrate the power of this engine, consider a scenario where a user needs to explain renewable energy technology.
| Action | Input Details | Outcome |
|---|---|---|
| Input | Prompt: “Steps in the Solar Energy Process” + Slider set to 6 items. | The system interprets the prompt and layout constraints simultaneously. |
| Result | A fully rendered visual. | The AI renders a six-stage timeline complete with distinct colors, titles, technical descriptions, and even associated years. |
This automated generation replaces the tedious task of drawing shapes, aligning text boxes, and sourcing content.
Final Touches and Scalable Export
While the AI handles the structure and content generation, the user retains control for fine-tuning to ensure perfect readability and branding alignment.
Refinement
Users can resize text labels, move elements, or change colors if the AI-generated text overlaps slightly or if specific brand colors are required. The difference here is that the heavy lifting of layout construction is already finished.
SVG Export
Once satisfied, you can export your work as a high-quality SVG file. Because SVGs (Scalable Vector Graphics) are mathematically defined, they are scalable and editable. This makes them perfect for everything from responsive web publishing to high-resolution printing without pixelation.
Summary: A Workflow Upgrade
The biggest advantage of the Visual Paradigm AI approach is its flexibility for evolving content. In a traditional approach, adding a new data point might require a total redesign of the canvas. With this AI tool, you simply adjust the slider and regenerate. This ensures your infographic remains professional, balanced, and accurate regardless of how many steps your story requires.
-
AI-Powered Visual Modeling and Design Solutions by Visual Paradigm: AI-driven tools for visual modeling, diagramming, and software design that accelerate development workflows.
-
Visual Paradigm – All-in-One Visual Development Platform: A unified platform for visual modeling, software and business process design, and AI-powered development tools.
-
AI Chatbot Feature – Intelligent Assistance for Visual Paradigm Users: AI-powered chatbot that delivers instant guidance, automates tasks, and boosts productivity in Visual Paradigm.
-
Visual Paradigm Chat – AI-Powered Interactive Design Assistant: An interactive AI interface for generating diagrams, writing code, and solving design challenges in real time.
-
AI Textual Analysis – Transform Text into Visual Models Automatically: AI analyzes text documents to automatically generate UML, BPMN, and ERD diagrams for faster modeling and documentation.
-
Visual Paradigm AI Chatbot Enhances Multi-Language Support …: AI chatbot supports multiple languages, enabling seamless diagram generation in Spanish, French, Chinese, and more.